EX-99.2
Published on July 28, 2016
Exhibit 99.2
Second Quarter 2016 Earnings Call Presentation CALIFORNIA WATER SERVICE GROUP July 28, 2016
Forward-Looking Statements This presentation contains forward-looking statements within the meaning established by the Private Securities Litigation Reform Act of 1995 ("Act"). The forward-looking statements are intended to qualify under provisions of the federal securities laws for "safe harbor" treatment established by the Act. Forward-looking statements are based on currently available information, expectations, estimates, assumptions and projections, and management's judgment about the California drought and its effect on the Company. Words such as would, expects, intends, plans, believes, estimates, assumes, anticipates, projects, predicts, forecasts or variations of such words or similar expressions are intended to identify forward-looking statements. The forward-looking statements are not guarantees of future performance. They are subject to uncertainty and changes in circumstances. Actual results may vary materially from what is contained in a forward-looking statement. Factors that may cause a result different than expected or anticipated include, but are not limited to: governmental and regulatory commissions' decisions; changes in regulatory commissions' policies and procedures; the timeliness of regulatory commissions' actions concerning rate relief; eminent domain actions affecting our water systems; electric power interruptions; the ability to successfully implement conservation measures; changes in customer water use patterns; the impact of weather and climate on water sales and operating results; and, other risks and unforeseen events. When considering forward-looking statements, you should keep in mind the cautionary statements included in this paragraph, as well as the annual 10-K, Quarterly 10-Q, and other reports filed from time-to-time with the Securities and Exchange Commission (SEC). The Company assumes no obligation to provide public updates of forward-looking statements. 2
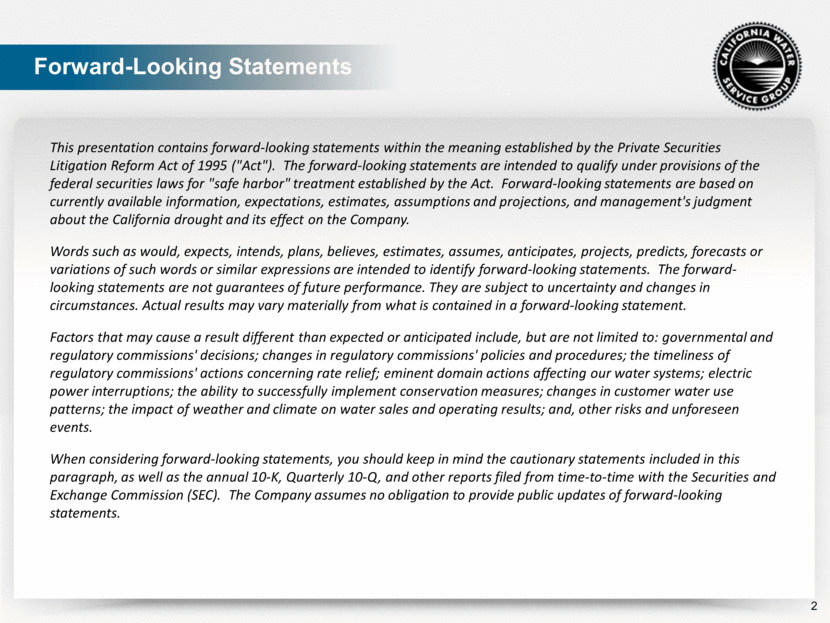
Todays Participants Marty Kropelnicki President & CEO Tom Smegal Vice President, CFO & Treasurer 3
Presentation Overview Financial Results Financial Highlights Drought Update Regulatory Update Capital Investment History and Projection Net WRAM Balances EPS Bridge YTD 2015 to YTD 2016 Recent Awards 4
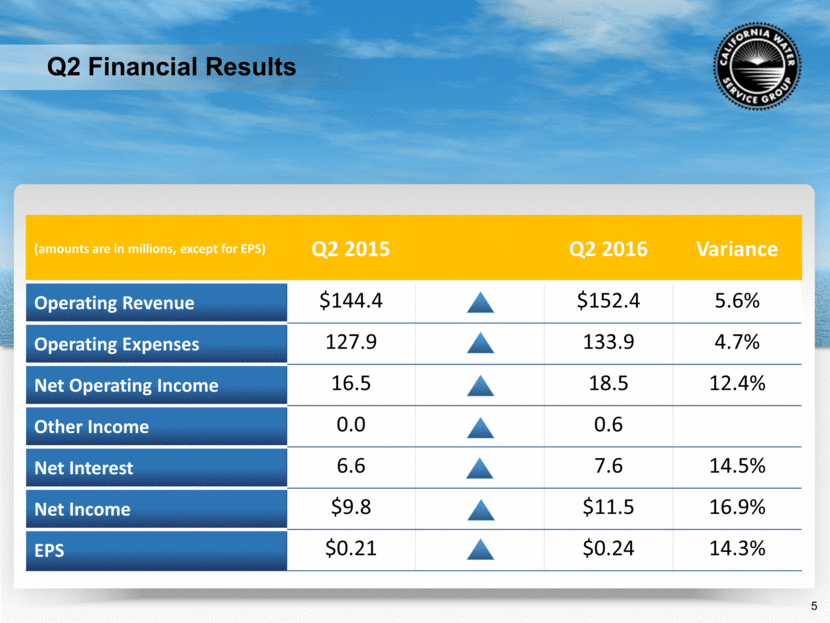
Q2 Financial Results (amounts are in millions, except for EPS) Q2 2015 Q2 2016 Variance Operating Revenue $144.4 $152.4 5.6% Operating Expenses 127.9 133.9 4.7% Net Operating Income 16.5 18.5 12.4% Other Income 0.0 0.6 Net Interest 6.6 7.6 14.5% Net Income $9.8 $11.5 16.9% EPS $0.21 $0.24 14.3% 5
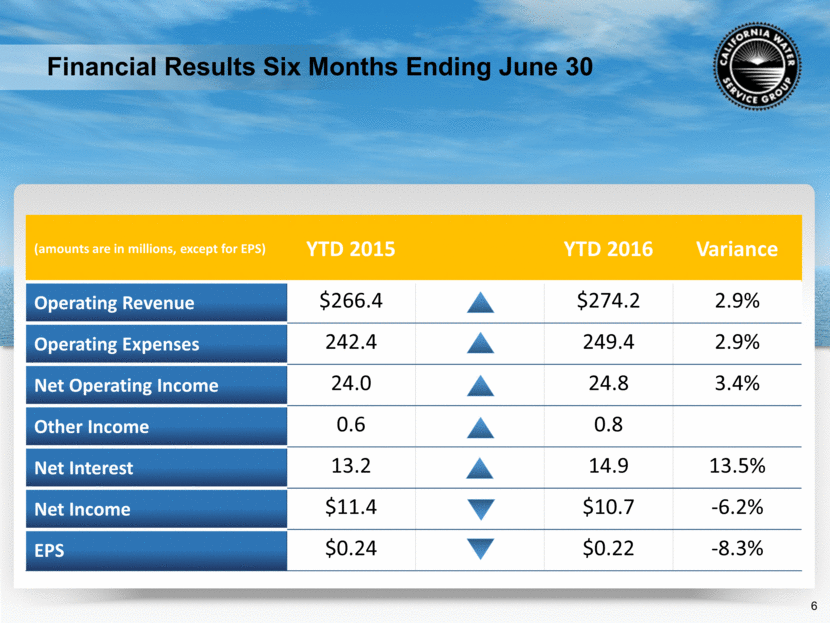
Financial Results Six Months Ending June 30 (amounts are in millions, except for EPS) YTD 2015 YTD 2016 Variance Operating Revenue $266.4 $274.2 2.9% Operating Expenses 242.4 249.4 2.9% Net Operating Income 24.0 24.8 3.4% Other Income 0.6 0.8 Net Interest 13.2 14.9 13.5% Net Income $11.4 $10.7 -6.2% EPS $0.24 $0.22 -8.3% 6
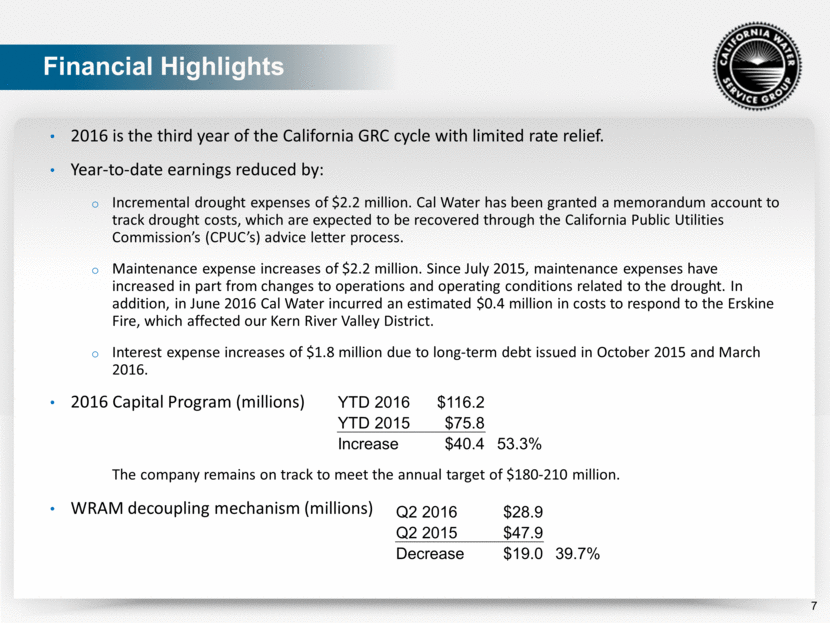
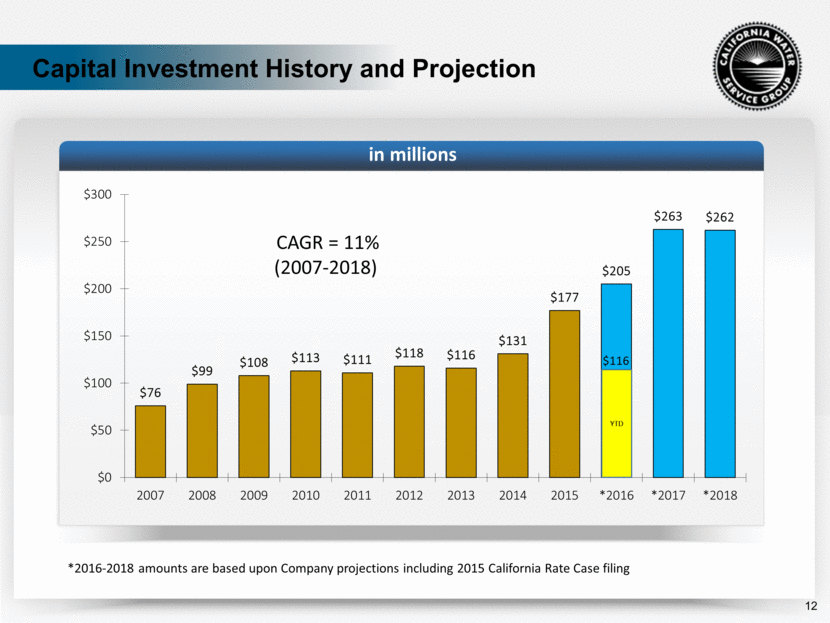
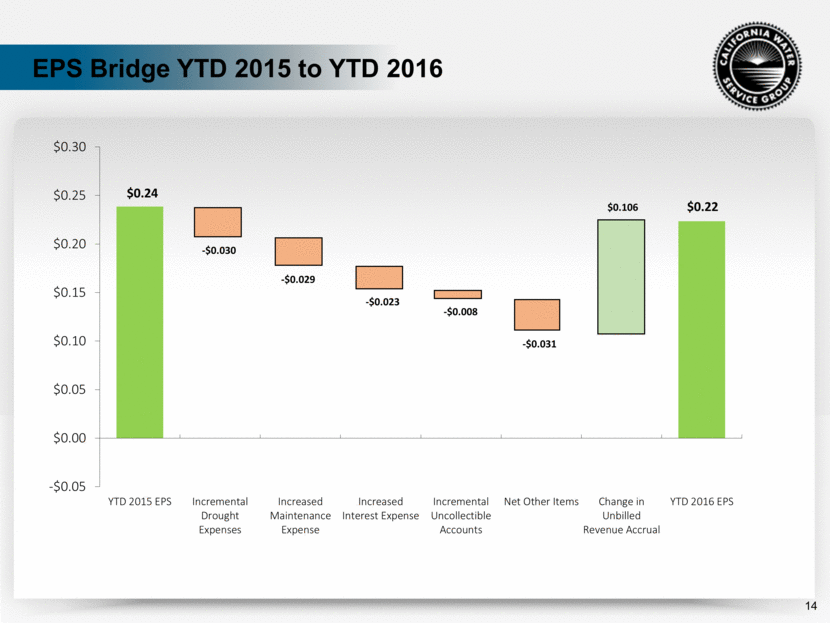
Financial Highlights 2016 is the third year of the California GRC cycle with limited rate relief. Year-to-date earnings reduced by: Incremental drought expenses of $2.2 million. Cal Water has been granted a memorandum account to track drought costs, which are expected to be recovered through the California Public Utilities Commissions (CPUCs) advice letter process. Maintenance expense increases of $2.2 million. Since July 2015, maintenance expenses have increased in part from changes to operations and operating conditions related to the drought. In addition, in June 2016 Cal Water incurred an estimated $0.4 million in costs to respond to the Erskine Fire, which affected our Kern River Valley District. Interest expense increases of $1.8 million due to long-term debt issued in October 2015 and March 2016. 2016 Capital Program (millions) The company remains on track to meet the annual target of $180-210 million. WRAM decoupling mechanism (millions) 7 YTD 2016 $116.2 YTD 2015 $75.8 Increase $40.4 53.3% Q2 2016 $28.9 Q2 2015 $47.9 Decrease $19.0 39.7%
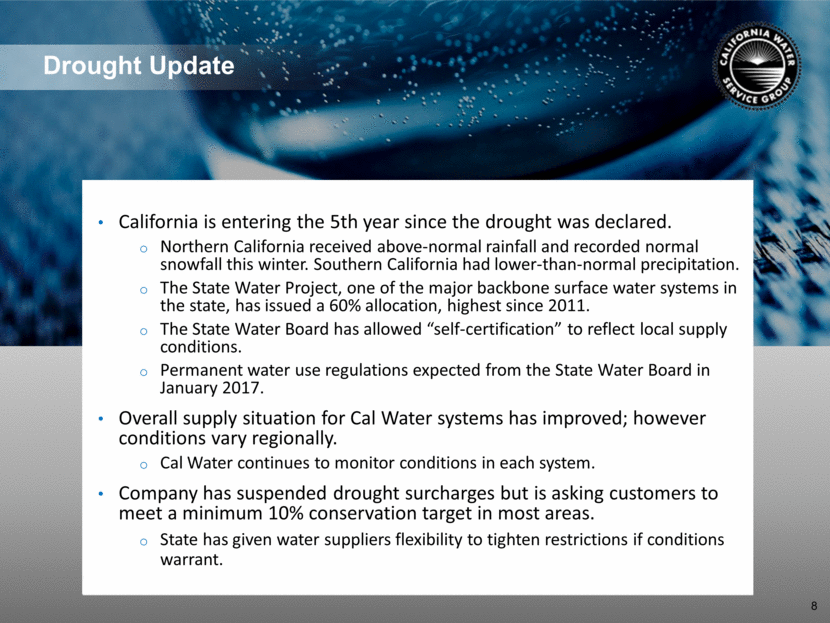
Drought Update 8 California is entering the 5th year since the drought was declared. Northern California received above-normal rainfall and recorded normal snowfall this winter. Southern California had lower-than-normal precipitation. The State Water Project, one of the major backbone surface water systems in the state, has issued a 60% allocation, highest since 2011. The State Water Board has allowed self-certification to reflect local supply conditions. Permanent water use regulations expected from the State Water Board in January 2017. Overall supply situation for Cal Water systems has improved; however conditions vary regionally. Cal Water continues to monitor conditions in each system. Company has suspended drought surcharges but is asking customers to meet a minimum 10% conservation target in most areas. State has given water suppliers flexibility to tighten restrictions if conditions warrant.
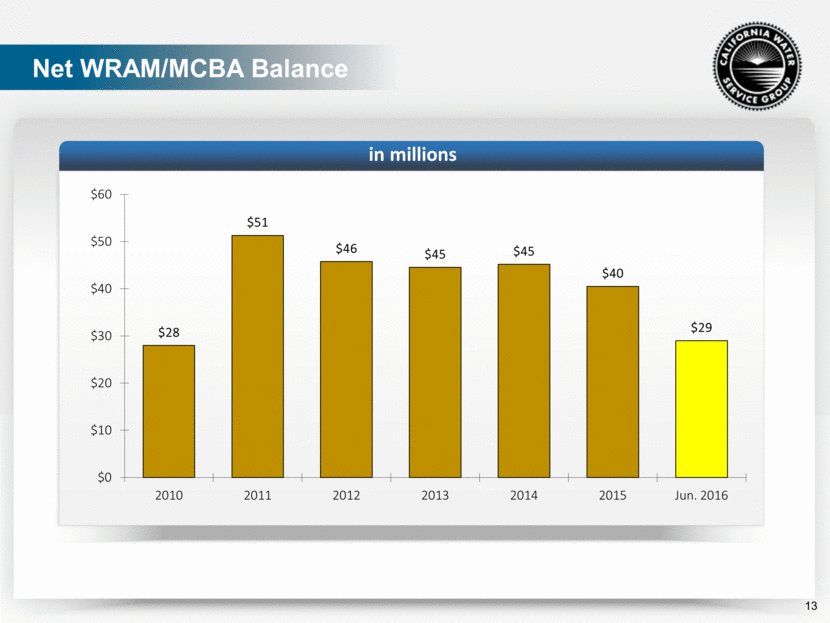
Drought Financial Effects Muted by Regulatory Mechanisms Cal Water has been decoupled (minimizes effect of sales and water production costs on earnings) since 2008 with WRAM. Sales decline will not reduce profits. Revenue accrual, not included in WRAM, a short-term impact. Drought costs recorded for future recovery of $3.2 million or $0.04 EPS impact in 2016 YTD. On July 15, 2016, Cal Water filed an advice letter to recover $4.2 million of incremental drought expenses associated with calendar years 2014 and 2015. The Company expects to receive approval from the Commission on this advice letter filing before the end of 2016. Customer surcharges flow to reduce WRAM balances. With $22.1 million of drought surcharges recorded year to date, WRAM balance declined $11.6 million YTD. Lower sales estimates embedded in 2016 rates for most service areas are expected to improve cash collection. 9
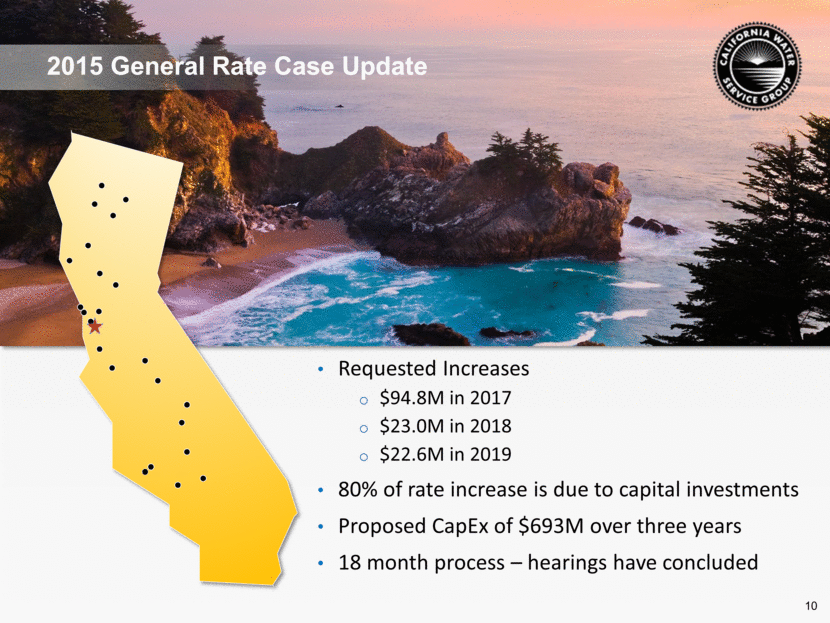
2015 General Rate Case Update Requested Increases $94.8M in 2017 $23.0M in 2018 $22.6M in 2019 80% of rate increase is due to capital investments Proposed CapEx of $693M over three years 18 month process hearings have concluded 10
2015 General Rate Case Update Schedule Update The Company reviewed intervenors recommendations and composed rebuttal testimony during the second quarter of 2016. During the months of June and July, the Company and intervening parties met in settlement discussions and on July 18, 2016, Cal Water completed the rate case evidentiary hearings at the California Public Utilities Commission (CPUC). The case is being processed according to the adopted schedule which would allow for a decision at the end of 2016. Please Note: All settlement discussions in the proceeding are confidential. The company may not discuss whether any items in the case have settled or the nature of any potentially settled matter unless or until an executed settlement agreement is filed with the Commission. 11
Capital Investment History and Projection in millions *2016-2018 amounts are based upon Company projections including 2015 California Rate Case filing CAGR = 11% (2007-2018) 12 YTD $116
Net WRAM/MCBA Balance in millions 13
EPS Bridge YTD 2015 to YTD 2016 14
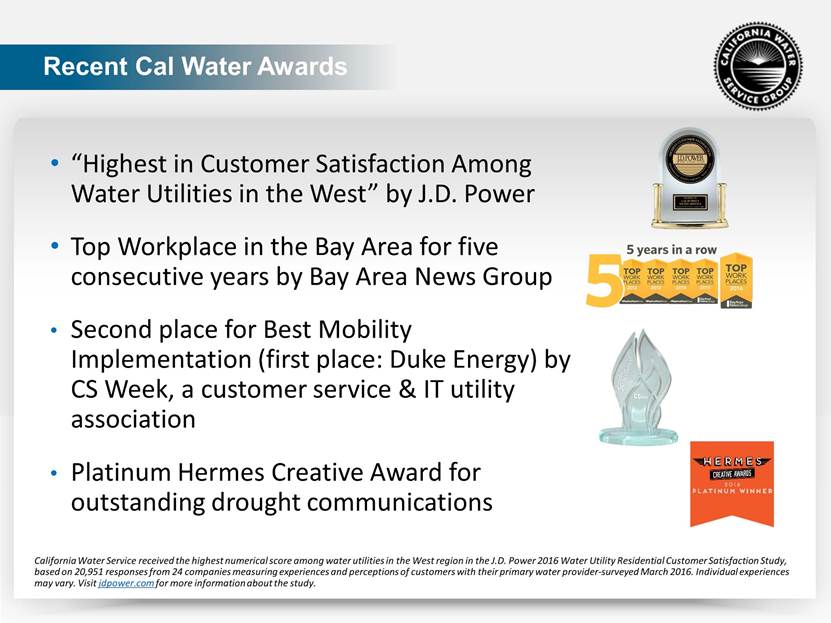
Recent Cal Water Awards Highest in Customer Satisfaction Among Water Utilities in the West by J.D. Power Top Workplace in the Bay Area for five consecutive years by Bay Area News Group Second place for Best Mobility Implementation (first place: Duke Energy) by CS Week, a customer service & IT utility association Platinum Hermes Creative Award for outstanding drought communications California Water Service received the highest numerical score among water utilities in the West region in the J.D. Power 2016 Water Utility Residential Customer Satisfaction Study, based on 20,951 responses from 24 companies measuring experiences and perceptions of customers with their primary water provider-surveyed March 2016. Individual experiences may vary. Visit jdpower.com for more information about the study.
DISCUSSION
