EX-99.2
Published on October 27, 2016
Exhibit 99.2
Third Quarter 2016 Earnings Call Presentation CALIFORNIA WATER SERVICE GROUP October 27, 2016
Forward-Looking Statements This presentation contains forward-looking statements within the meaning established by the Private Securities Litigation Reform Act of 1995 ("Act"). The forward-looking statements are intended to qualify under provisions of the federal securities laws for "safe harbor" treatment established by the Act. Forward-looking statements are based on currently available information, expectations, estimates, assumptions and projections, and management's judgment about the California drought and its effect on the Company. Words such as would, expects, intends, plans, believes, estimates, assumes, anticipates, projects, predicts, forecasts or variations of such words or similar expressions are intended to identify forward-looking statements. The forward-looking statements are not guarantees of future performance. They are subject to uncertainty and changes in circumstances. Actual results may vary materially from what is contained in a forward-looking statement. Factors that may cause a result different than expected or anticipated include, but are not limited to: governmental and regulatory commissions' decisions; changes in regulatory commissions' policies and procedures; the timeliness of regulatory commissions' actions concerning rate relief; eminent domain actions affecting our water systems; electric power interruptions; the ability to successfully implement conservation measures; changes in customer water use patterns; the impact of weather and climate on water sales and operating results; and, other risks and unforeseen events. When considering forward-looking statements, you should keep in mind the cautionary statements included in this paragraph, as well as the annual 10-K, Quarterly 10-Q, and other reports filed from time-to-time with the Securities and Exchange Commission (SEC). The Company assumes no obligation to provide public updates of forward-looking statements. 2
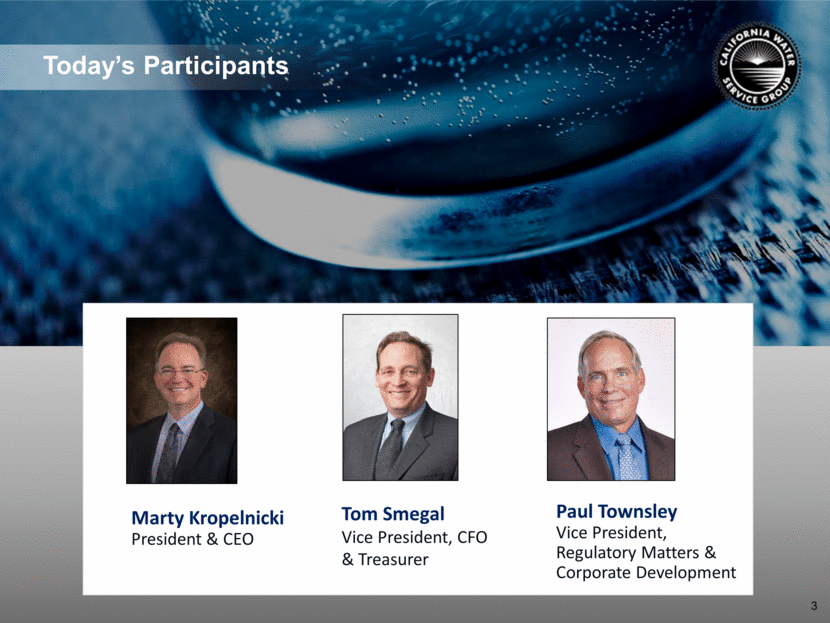
Todays Participants Marty Kropelnicki President & CEO 3 Paul Townsley Vice President, Regulatory Matters & Corporate Development Tom Smegal Vice President, CFO & Treasurer
Presentation Overview Financial Results Financial Highlights and EPS Bridge California GRC Update Drought Update Travis Air Force Base Contract Cap Ex 2007 Recorded to 2018 Projected Estimated regulated rate base 2014-2019 Net WRAM Balances 2010-2016 Our priorities moving forward 4
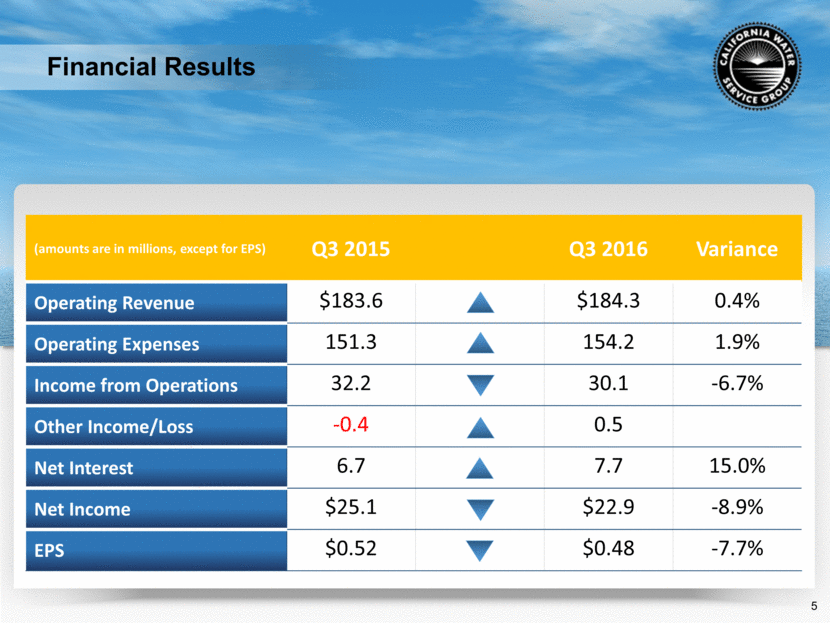
Financial Results (amounts are in millions, except for EPS) Q3 2015 Q3 2016 Variance Operating Revenue $183.6 $184.3 0.4% Operating Expenses 151.3 154.2 1.9% Income from Operations 32.2 30.1 -6.7% Other Income/Loss -0.4 0.5 Net Interest 6.7 7.7 15.0% Net Income $25.1 $22.9 -8.9% EPS $0.52 $0.48 -7.7% 5
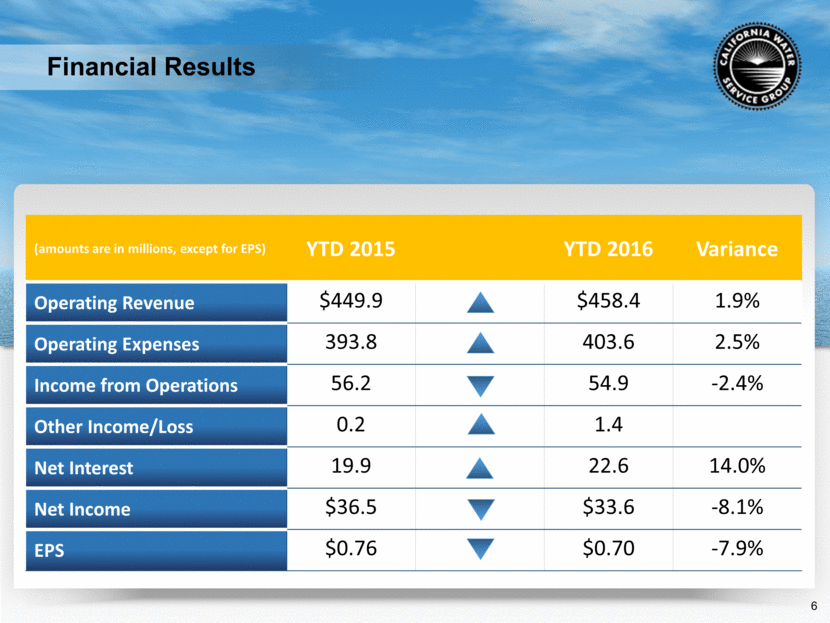
Financial Results (amounts are in millions, except for EPS) YTD 2015 YTD 2016 Variance Operating Revenue $449.9 $458.4 1.9% Operating Expenses 393.8 403.6 2.5% Income from Operations 56.2 54.9 -2.4% Other Income/Loss 0.2 1.4 Net Interest 19.9 22.6 14.0% Net Income $36.5 $33.6 -8.1% EPS $0.76 $0.70 -7.9% 6
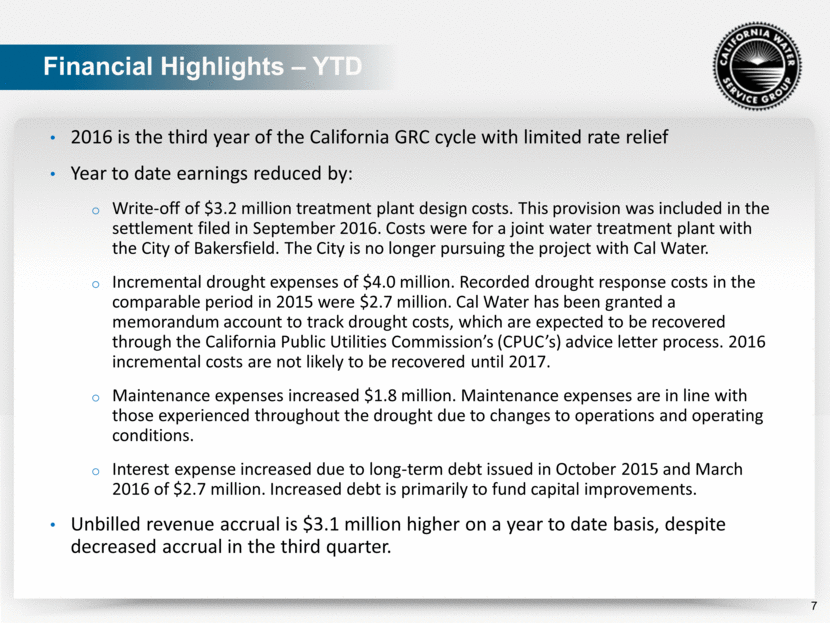
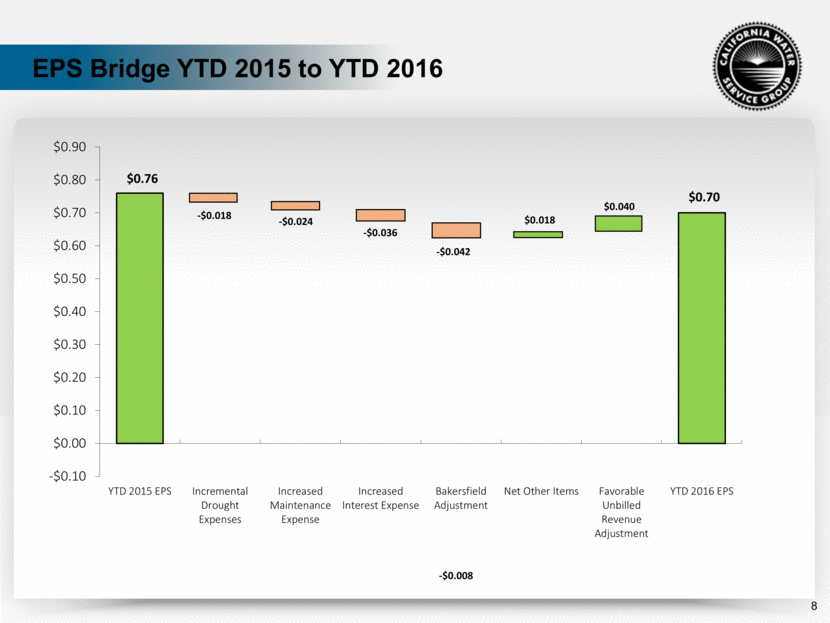
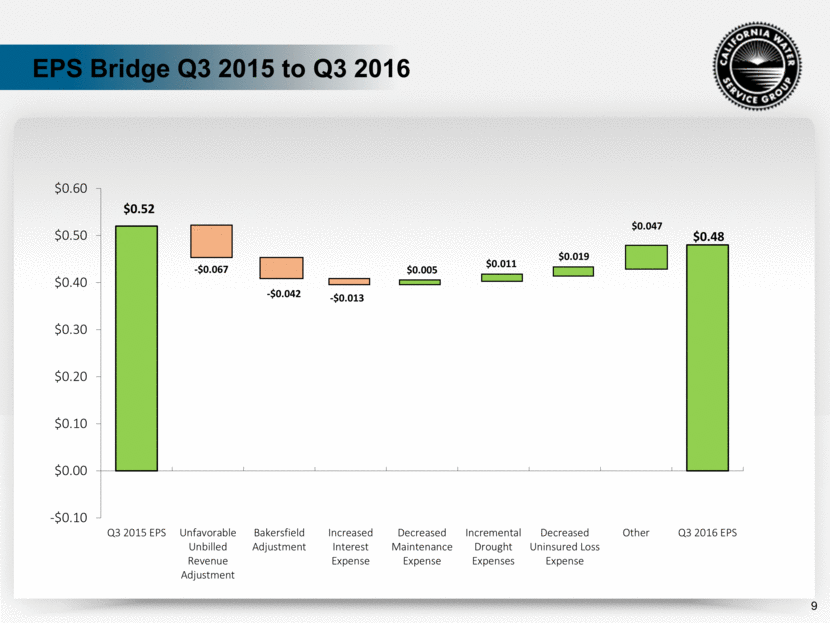
Financial Highlights YTD 2016 is the third year of the California GRC cycle with limited rate relief Year to date earnings reduced by: Write-off of $3.2 million treatment plant design costs. This provision was included in the settlement filed in September 2016. Costs were for a joint water treatment plant with the City of Bakersfield. The City is no longer pursuing the project with Cal Water. Incremental drought expenses of $4.0 million. Recorded drought response costs in the comparable period in 2015 were $2.7 million. Cal Water has been granted a memorandum account to track drought costs, which are expected to be recovered through the California Public Utilities Commissions (CPUCs) advice letter process. 2016 incremental costs are not likely to be recovered until 2017. Maintenance expenses increased $1.8 million. Maintenance expenses are in line with those experienced throughout the drought due to changes to operations and operating conditions. Interest expense increased due to long-term debt issued in October 2015 and March 2016 of $2.7 million. Increased debt is primarily to fund capital improvements. Unbilled revenue accrual is $3.1 million higher on a year to date basis, despite decreased accrual in the third quarter. 7
EPS Bridge YTD 2015 to YTD 2016 8
EPS Bridge Q3 2015 to Q3 2016 9
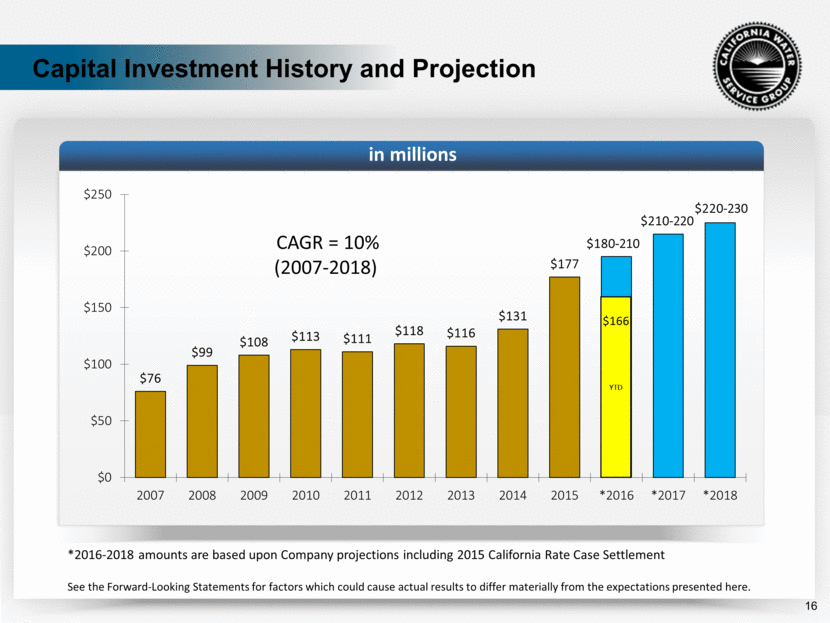
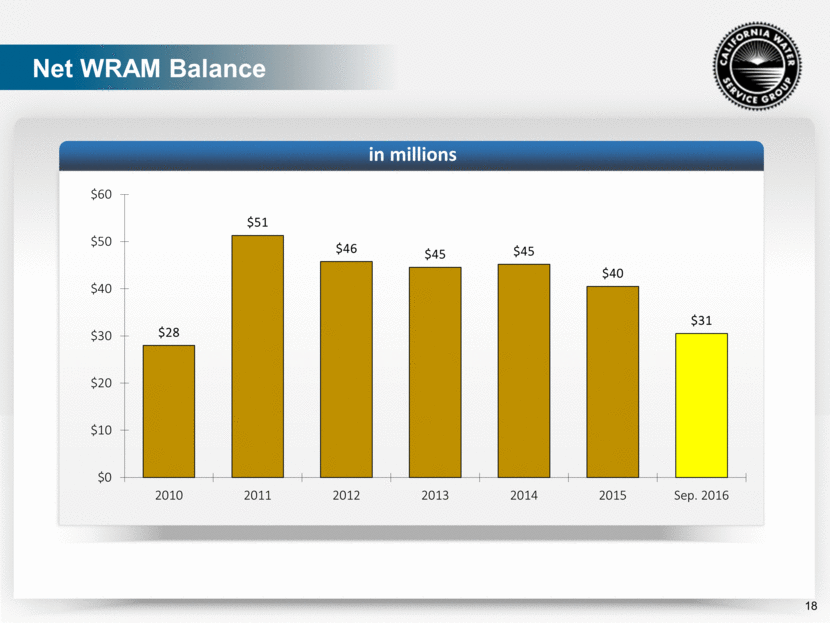
Other Financial Highlights Capital investments were $166.4 million in the first nine months of 2016, on track to meet the annual target of $180-210 million. This is an increase of $48.1 million or 40.6% compared to the first nine months of 2015. The customer receivable for the WRAM decoupling mechanism increased slightly from the second quarter due to the elimination of drought surcharges. However, the balance is down significantly since the start of the drought. 10
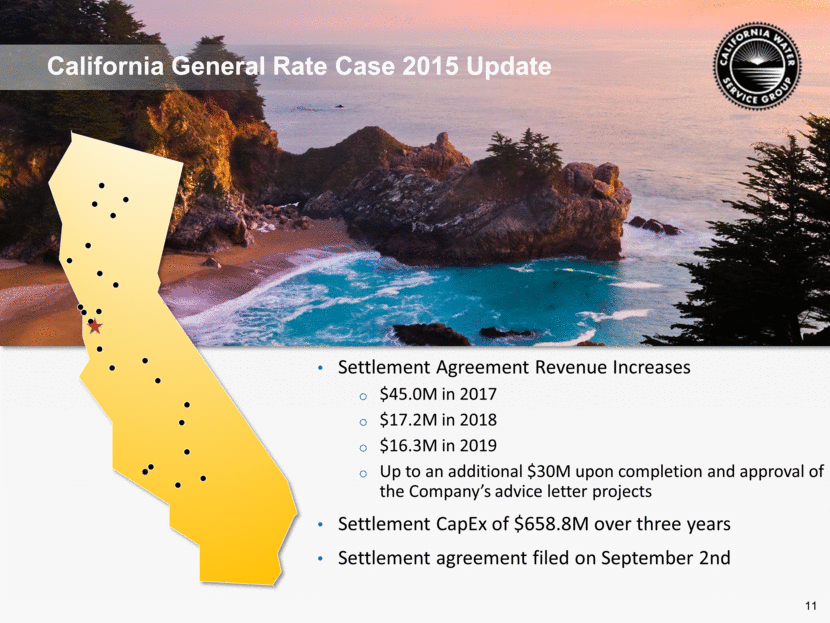
California General Rate Case 2015 Update Settlement Agreement Revenue Increases $45.0M in 2017 $17.2M in 2018 $16.3M in 2019 Up to an additional $30M upon completion and approval of the Companys advice letter projects Settlement CapEx of $658.8M over three years Settlement agreement filed on September 2nd 11
Regulatory Update - Continued California GRC Schedule Milestones Settlement was filed on September 2, 2016 Motion for interim rates granted October 7, 2016 To achieve a final decision by January 1, 2017, CPUC must issue a proposed decision by mid-November Hawaii GRCs On September 12, 2016 the Hawaii Public Utilities Commission approved our Kaanapali rate increase settlement. The settlement increases rates $1.1 million. Importantly, the case was processed in ten months, indicating an improved ability to process our water rate cases in Hawaii. 12
Drought Update 13 While statewide drought restrictions have been lifted, much of California is still in a drought States surface water supply relies heavily on winter rain and snowfall Low snowfall this winter may trigger a return to drought restrictions As required by the State Water Board, Cal Water reduced its conservation mandates in July 2016 Drought surcharges were suspended on July 29 Cal Water customers generally must meet a 10% voluntary conservation target Permanent water use regulations expected from State Board in January 2017
Drought Financial Effects Muted by Regulatory Mechanisms Cal Water has been decoupled (minimizes effect of sales and production costs on earnings) since 2008 with WRAM Sales changes will not affect profits Revenue accrual, not included in WRAM, is a temporary impact Drought costs recorded for future recovery $0.05 EPS impact in 2016 to date A supplemental advice letter was filed on October 12, 2016 by Cal Water to recover $2.9 million in incremental drought costs associated with calendar years 2014 and 2015. This advice letter will be recoverable to the extent authorized by the CPUC in a future period and is not opposed by ratepayer advocates. Customer surcharges made a large impact in reducing WRAM balances Between the end of 2014 and July 2016, Cal Water collected $63 million in drought surcharges and the net WRAM balance declined $14 million Lower sales estimates embedded in 2016 rates for most service areas is expected to improve cash collection for the remainder of the year 14
Travis Air Force Base Contract Cal Water has entered into a 50-year agreement with the U.S. Department of Defense to acquire the water distribution assets of, and to provide water utility service to, the Travis Air Force Base beginning in 2018, subject to California Public Utilities Commission approval. Contract is based on the regulated utility model, meaning Cal Water invests capital in the system and earns an authorized return on the assets while passing through other operating costs on a dollar-for-dollar basis. Travis Air Force Base is located adjacent to Fairfield, California, and near Cal Water's Dixon service area. Large military transport base with about 15,000 daytime population Cal Water will make initial capital improvements of about $12.7 million, with an anticipated capital investment of about $52 million over the 50-year term of the utility service contract. 15
Capital Investment History and Projection in millions *2016-2018 amounts are based upon Company projections including 2015 California Rate Case Settlement See the Forward-Looking Statements for factors which could cause actual results to differ materially from the expectations presented here. CAGR = 10% (2007-2018) 16 YTD $166
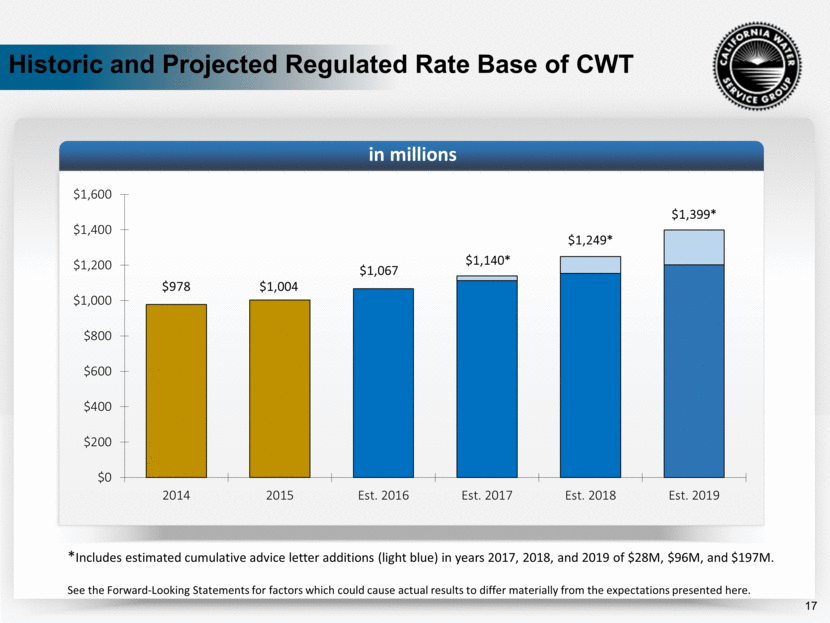
Historic and Projected Regulated Rate Base of CWT in millions 17 *Includes estimated cumulative advice letter additions (light blue) in years 2017, 2018, and 2019 of $28M, $96M, and $197M. See the Forward-Looking Statements for factors which could cause actual results to differ materially from the expectations presented here.
Net WRAM Balance in millions 18
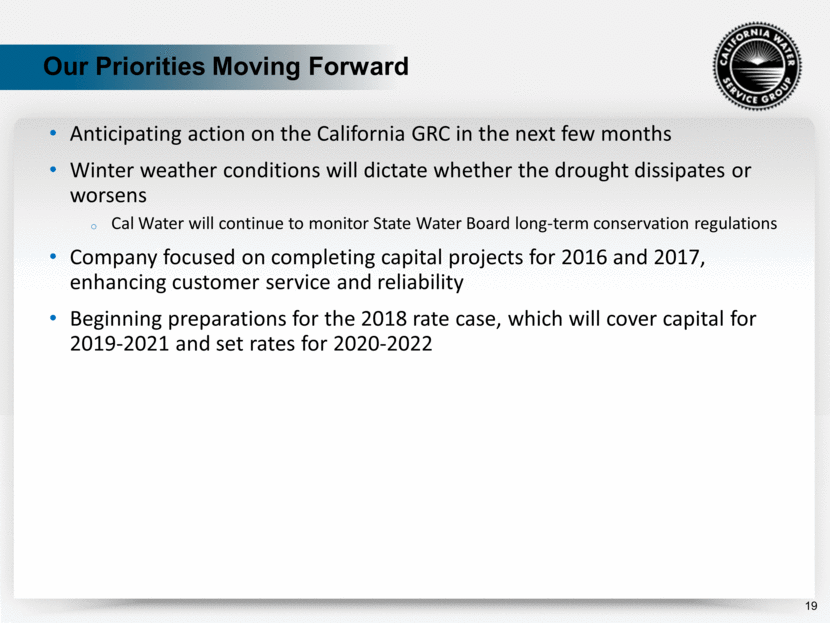
Our Priorities Moving Forward Anticipating action on the California GRC in the next few months Winter weather conditions will dictate whether the drought dissipates or worsens Cal Water will continue to monitor State Water Board long-term conservation regulations Company focused on completing capital projects for 2016 and 2017, enhancing customer service and reliability Beginning preparations for the 2018 rate case, which will cover capital for 2019-2021 and set rates for 2020-2022 19
DISCUSSION
