EX-99.2
Published on November 1, 2018
California Water Service Group Third-Quarter 2018 Earnings Call Presentation November 1, 2018

Forward-Looking Statements This presentation contains forward-looking statements within the meaning established by the Private Securities Litigation Reform Act of 1995 ("Act"). The forward-looking statements are intended to qualify under provisions of the federal securities laws for "safe harbor" treatment established by the Act. Forward-looking statements are based on currently available information, expectations, estimates, assumptions and projections, and management's judgment. Words such as would, expects, intends, plans, believes, estimates, assumes, anticipates, projects, predicts, forecasts or variations of such words or similar expressions are intended to identify forward-looking statements. The forward-looking statements are not guarantees of future performance. They are subject to uncertainty and changes in circumstances. Actual results may vary materially from what is contained in a forward-looking statement. Factors that may cause a result different than expected or anticipated include, but are not limited to: governmental and regulatory commissions' decisions; changes in regulatory commissions' policies and procedures; the timeliness of regulatory commissions' actions concerning rate relief; changes in tax laws, the interpretation of tax laws, and accounting policies; changes in construction costs and availability of resources; the ability to successfully implement conservation measures; changes in customer water use patterns; the impact of weather and climate on water sales and operating results; and, other risks and unforeseen events. When considering forward-looking statements, you should keep in mind the cautionary statements included in this paragraph, as well as the annual 10-K, Quarterly 10-Q, and other reports filed from time- to-time with the Securities and Exchange Commission (SEC). The Company assumes no obligation to provide public updates of forward-looking statements. 2
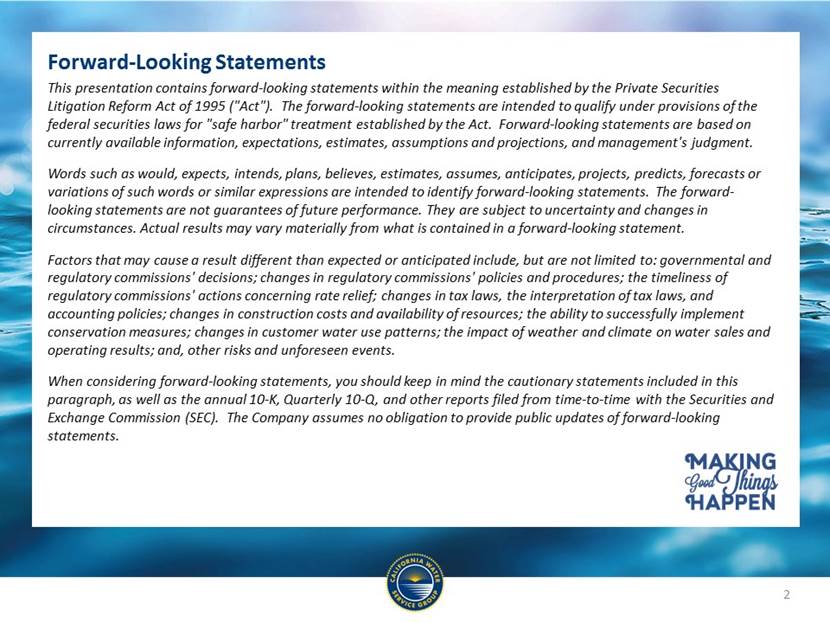
Marty Kropelnicki President & CEO Todays Participants Tom Smegal Vice President, CFO & Treasurer 3
Presentation Overview Our Operating Priorities Financial Results and Highlights EPS Bridges: Q3 2017 to Q3 2018 and YTD 2017 to YTD 2018 2018 California General Rate Case (GRC) and Other Rate Filings California Fires and Emergency Response Other Recent Activities Regulatory Balancing Account Update Capital Investment History and Projection Regulated Rate Base of CWT Summary 4
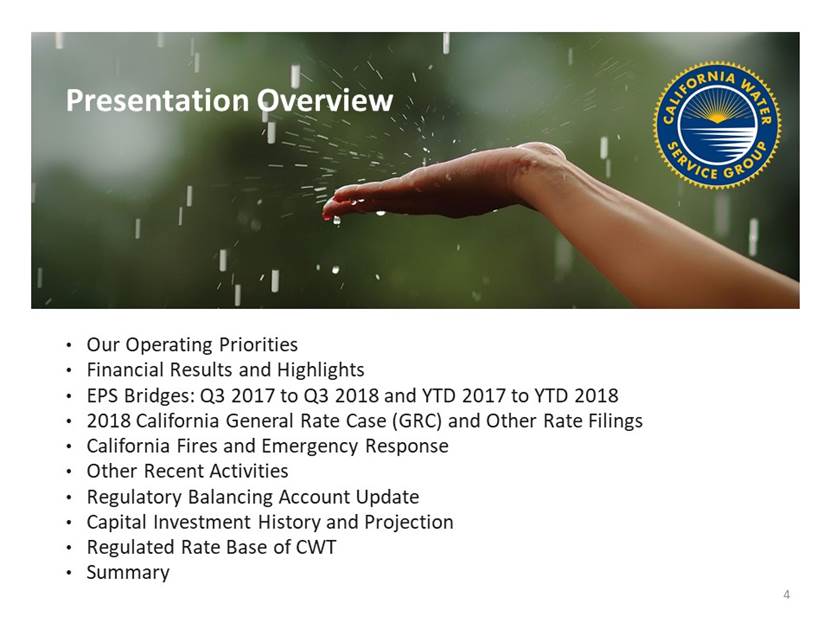
Our Operating Priorities 5
(amounts are in millions, except for EPS) Q3 2017 Q3 2018 Variance Operating Revenue $211.7 $219.0 3.4% Operating Expenses $169.3 $173.4 2.5% Net Interest Expense $8.6 $10.3 20.3% Net Income $33.8 $34.4 1.6% EPS $0.70 $0.72 1.5% Capital Investments $71.7 $79.0 10.2% Financial Results: Third Quarter 6
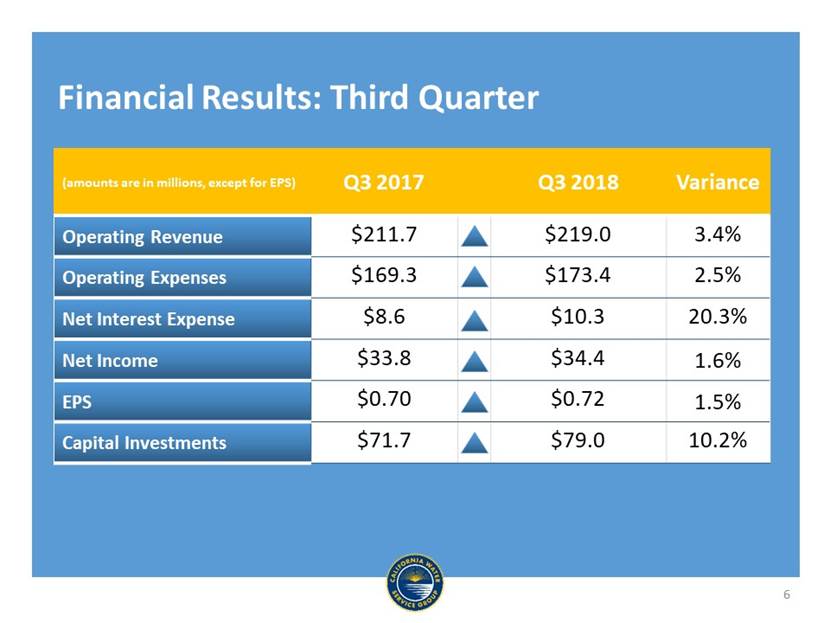
(amounts are in millions, except for EPS) YTD 2017 YTD 2018 Variance Operating Revenue $504.9 $523.9 3.8% Operating Expenses $425.2 $445.2 4.7% Net Interest Expense $25.3 $28.8 14.0% Net Income $53.5 $44.9 -16.2% EPS $1.11 $0.93 -16.2% Capital Investments $180.4 $212.9 18.0% Financial Results: Year-to-Date 7
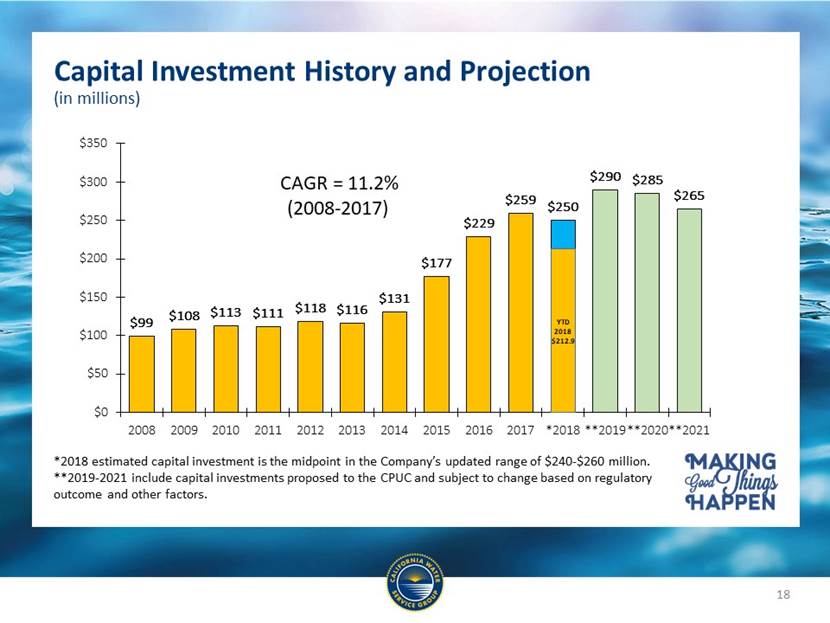
Q3 Financial Highlights Third quarter earnings increase of $0.6 million largely attributable to: Revenue increase due to $4.4 million of aggregate rate increases, net of the revenue reductions from the California Water Service (Cal Water) Cost of Capital decision. The revenue increase was partially offset by a $1.8 million increase in depreciation and amortization, employee wage increases of $1.5 million, a $1.3 million increase in new business expenses, and a $1.7 million increase in interest expense. Year to date Company and developer funded capital investments were $212.9 million, an increase of 18.0% compared to 2017 Company anticipates capital investment between $240-260 million in 2018 8
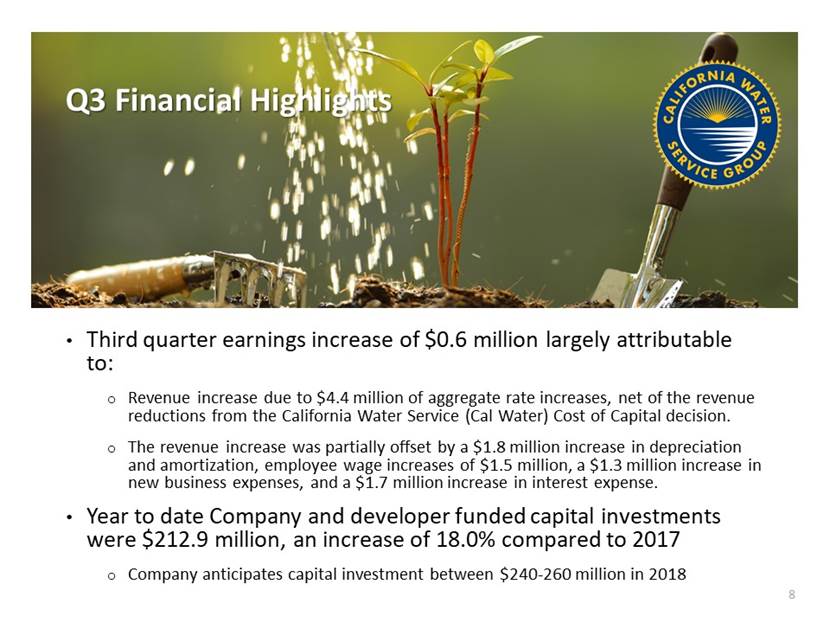
EPS Bridge Q3 2017 to Q3 2018 9
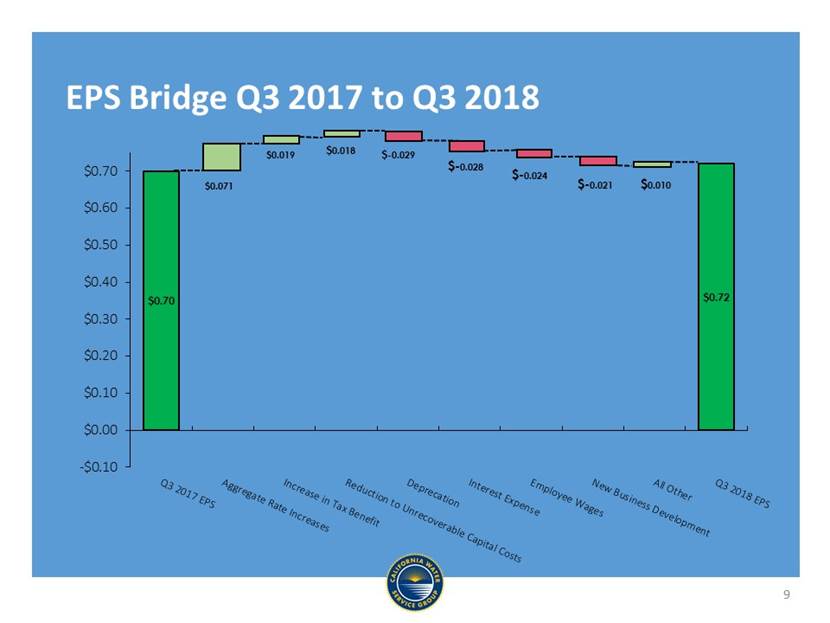
EPS Bridge YTD 2017 to YTD 2018 10
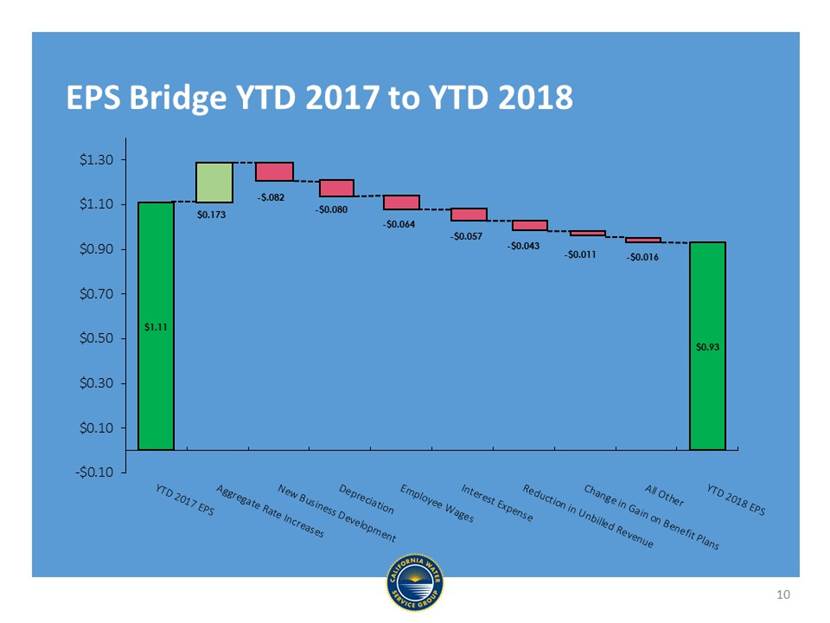
Notes on EPS Bridge Items Increased revenue includes California escalation increases net of the California Cost of Capital revenue reduction effective January 1, 2018, as well as rate base offset rate relief and effect of Hawaii rate increases since corresponding period in 2017 Increased depreciation consistent with additional capital investment placed into service in 2017 11
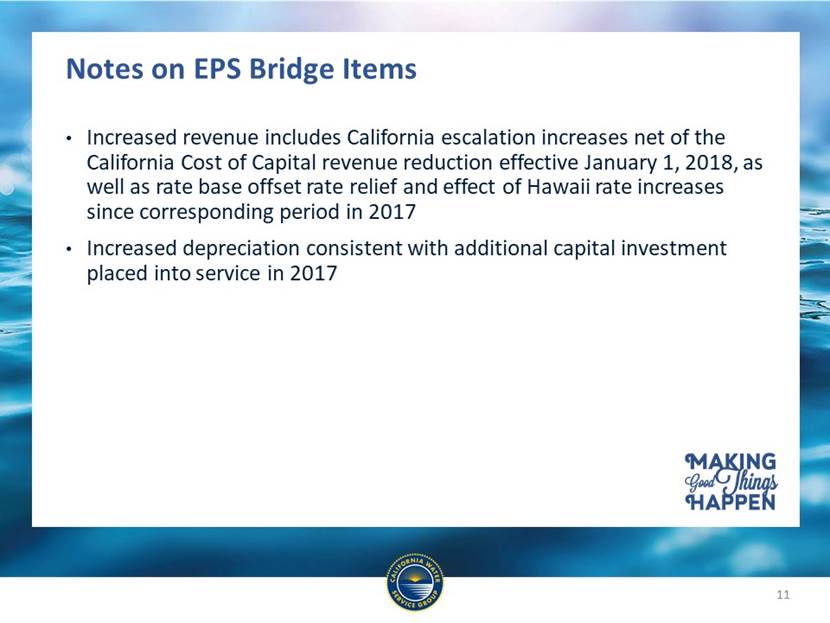
Cal Water filed its 2018 GRC on July 2, requesting $828.5 million in capital investments over the period 2019-2021 GRC is in the discovery phase through Q1 2019 Two municipalities and the California Public Advocate (Formerly Office of Ratepayer Advocates) are participating in the case Testimony is anticipated in the first or second quarter of 2019 2018 California General Rate Case 12
Other Rate Filings Hawaii Waikoloa rate cases, filed in December 2017 requesting increases of $3.8 million in annual revenue Proceedings are ongoing and the Company anticipates a Hawaii Public Utilities Commission decision by year end Washington Water GRC was filed on July 2, requesting $1.6 million annual revenue increase The Company anticipates a Washington Utilities and Transportation Commission decision before year-end Through October 31, 2018, CPUC had approved advice letter projects totaling additional $4.9 million of annual revenue out of authorization of up to $30 million through 2019 No new approvals since July 1 Cal Water required to file its escalation rate increase of up to $16 million annual revenue by November 15 with rates effective on January 1, 2019 13
California Fires and Emergency Response We continue our efforts to train for and manage incidents using the emergency operations center (EOC) framework EOCs have been activated nearly 20 times in the last three years During the quarter, Cal Waters EOC was used in the Mendocino Complex fire, the largest in the states history, which threatened one of our systems Our team operated the Lucerne water system throughout the incident, including during mandatory evacuations, to help firefighters protect the community We coordinated with State and County officials in their EOCs 14
Other Recent Activities Company issued $300 million of 2-year first mortgage bonds in September Used to refinance the revolving credit facility Will continue to finance capital improvements using line of credit and a combination of long-term debt and equity targeting the CPUC authorized capital structure In October, Hawaii Water assumed operation and maintenance of a wastewater utility on the island of Hawaii serving approximately 1,500 customers 15
Regulatory Balancing Account Update Cal Water year-to-date sales are 94% of adopted estimates Change in adopted sales due to triggering the Sales Reconciliation Mechanism, which allows for a true-up when annual sales are above or below adopted sales by more than 5% The current WRAM receivable balance is $60.0 million, down from $69.1 million at year end 2017 Cal Water began billing surcharges to recover $50.1 million in net WRAM/MCBA receivables in April 2018 16
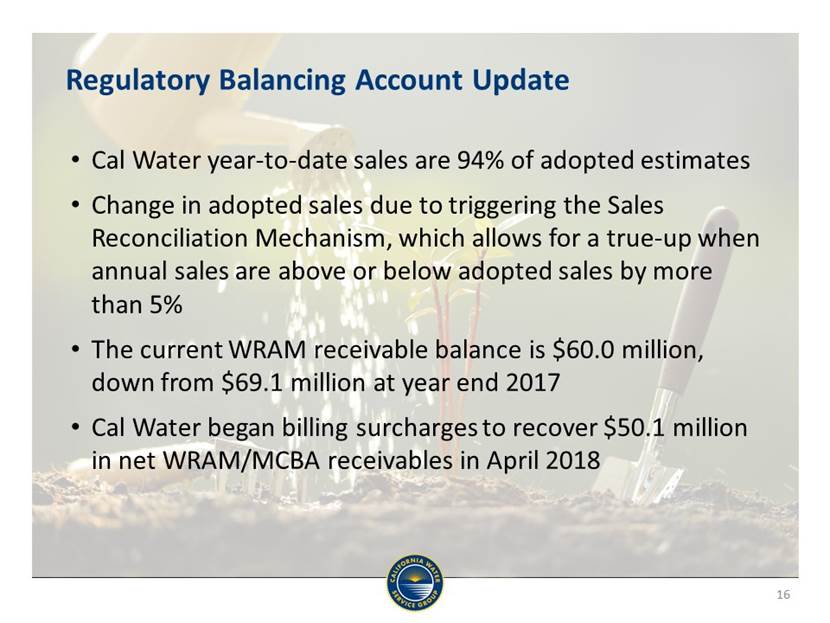
Net WRAM Receivable Balance (in millions; end-of-year balance except 2018) 17
Capital Investment History and Projection (in millions) *2018 estimated capital investment is the midpoint in the Companys updated range of $240-$260 million. **2019-2021 include capital investments proposed to the CPUC and subject to change based on regulatory outcome and other factors. CAGR = 11.2% (2008-2017) 18
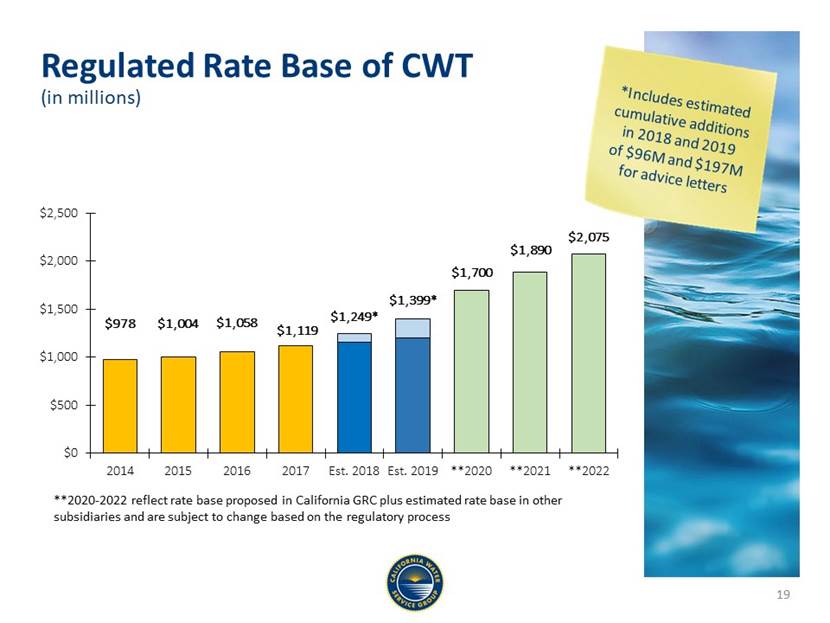
Regulated Rate Base of CWT Regulated Rate Base of CWT (in millions) *Includes estimated cumulative additions in 2018 and 2019 of $96M and $197M for advice letters 19 **2020-2022 reflect rate base proposed in California GRC plus estimated rate base in other subsidiaries and are subject to change based on the regulatory process
Summary Focus is on the 2018 California GRC filing Closing out rate cases in Hawaii and Washington On track to invest $240-$260 million in water system infrastructure in 2018 to provide safe, reliable service to our customers Company continues to focus on execution of long-term capital plan 20
[LOGO]
