EX-99.2
Published on April 25, 2019
2 Forward-Looking Statements This presentation contains forward-looking statements within the meaning established by the Private Securities Litigation Reform Act of 1995 ("Act"). The forward-looking statements are intended to qualify under provisions of the federal securities laws for "safe harbor" treatment established by the Act. Forward-looking statements are based on currently available information, expectations, estimates, assumptions and projections, and management's judgment. Words such as would, expects, intends, plans, believes, estimates, assumes, anticipates, projects, predicts, forecasts or variations of such words or similar expressions are intended to identify forward-looking statements. The forward-looking statements are not guarantees of future performance. They are subject to uncertainty and changes in circumstances. Actual results may vary materially from what is contained in a forward-looking statement. Factors that may cause a result different than expected or anticipated include, but are not limited to: governmental and regulatory commissions' decisions; changes in regulatory commissions' policies and procedures; the timeliness of regulatory commissions' actions concerning rate relief; changes in tax laws, the interpretation of tax laws, and accounting policies; changes in construction costs and availability of resources; the ability to successfully implement conservation measures; changes in customer water use patterns; the impact of weather and climate on water sales and operating results; and, other risks and unforeseen events. When considering forward-looking statements, you should keep in mind the cautionary statements included in this paragraph, as well as the annual 10-K, Quarterly 10-Q, and other reports filed from time-to-time with the Securities and Exchange Commission (SEC). The Company assumes no obligation to provide public updates of forward-looking statements.
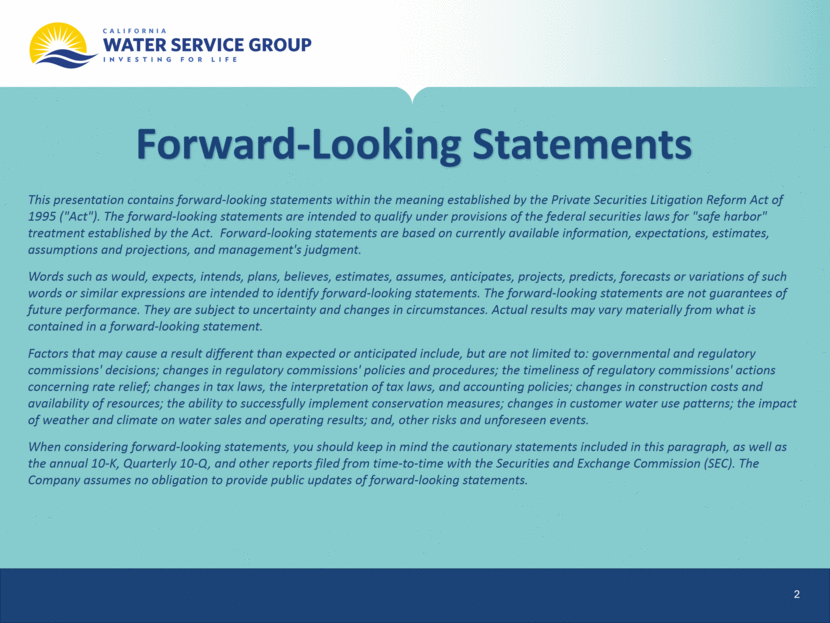
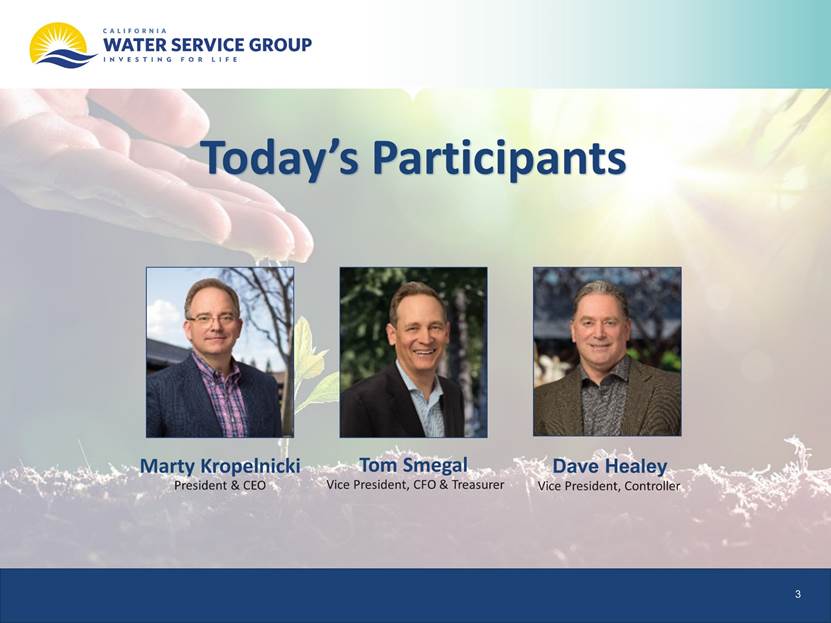
3 Todays Participants Marty Kropelnicki President & CEO Tom Smegal Vice President, CFO & Treasurer Dave Healey Vice President, Controller
4 Presentation Overview Our Operating Priorities Financial Results, First Quarter Financial Highlights Discussion of Earnings Seasonality EPS Bridge, First Quarter Capital Investment Update 2018 California General Rate Case (GRC) Other Regulatory Items Financing Activities Business Development Activities Decoupling Balancing Account Update Outlook for the Remainder of 2019 Cap Ex 2008 Recorded to 2021 Projected Rate Base 2014 recorded to 2022 Projected Summary
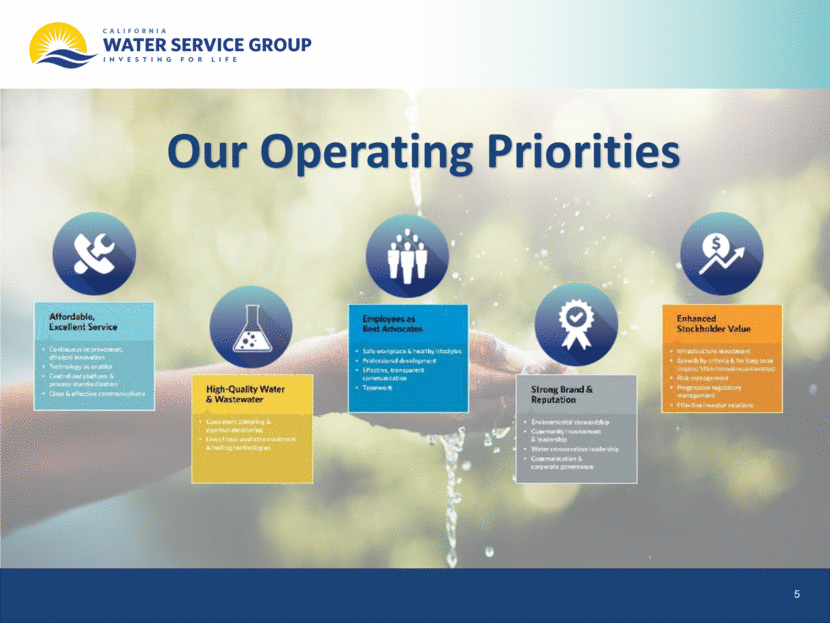
5 Our Operating Priorities
6 Financial Results: First Quarter (amounts are in millions, except for EPS) Q1 2018* Q1 2019 Variance Operating Revenue $134.6 $126.1 -6.3% Operating Expenses $124.7 $125.6 0.7% Net Interest Expense $8.7 $10.2 17.7% Net Loss -$0.8 -$7.6 -901.3% EPS -$0.02 -$0.16 -900.2% Capital Investments $70.7 $59.9 -15.3% *Reflects Q1 2018 results as disclosed in the first quarter 2019 Form 10-Q.
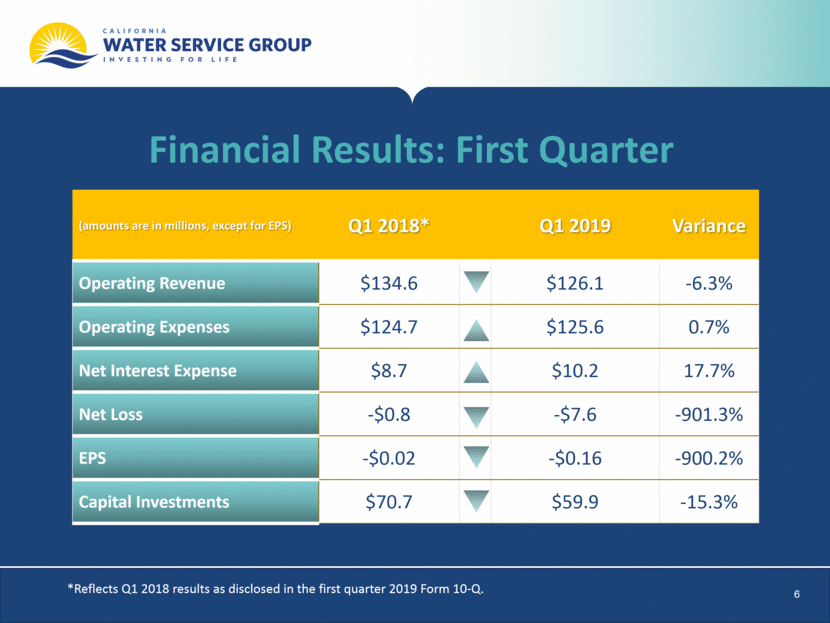
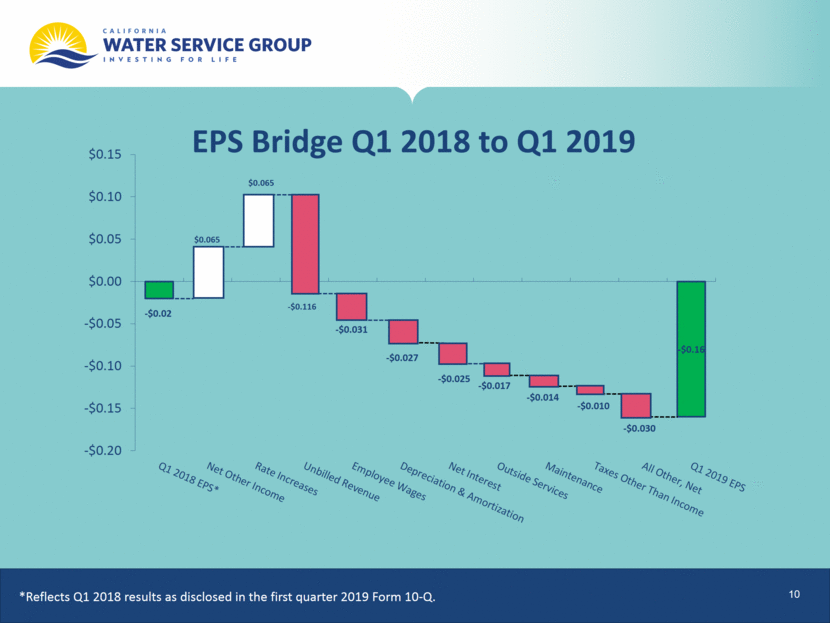
7 Q1 2019 Financial Highlights Net Loss increased by $6.8M to a total loss of $7.6M, largely attributable to: Reduced unbilled revenue accrual of $7.1M Wet weather through March lowered water sales, impacting the accrual Unbilled revenue accrual is outside the WRAM decoupling mechanism and represents amounts not yet billed to customers for water service during the quarter Increases in operating costs for employee wages ($1.9M), depreciation & amortization ($1.7M), interest expense ($1.5M), maintenance expense ($1.0M), outside services expense ($1.0M), and property taxes ($0.6M) exceeded increased revenue from rate increases of $4.0M Revenue increases are concentrated in the high-usage summer months while expense increases impact the company throughout the year Offset by a $3.4M increase in unrealized gain on benefit plan investments
California has had a wet winter which drove lower sales. While billed sales are recorded in the WRAM balancing account mechanism, unbilled revenue accrual is outside the WRAM and swings when usage is unusually high or low As the company grows rate base, fixed cost components such as depreciation, property taxes, and interest rise but rate increases, particularly in California, are collected in tiered quantity rates which are concentrated in the warm summer months. This is a longer-term trend for Cal Water which will recur unless the California Public Utilities Commission (CPUC) changes the Companys rate design In the 2018 GRC, Cal Water has requested to begin moving its fixed revenue components from 30% to 40% of revenue 8 Earnings Seasonality
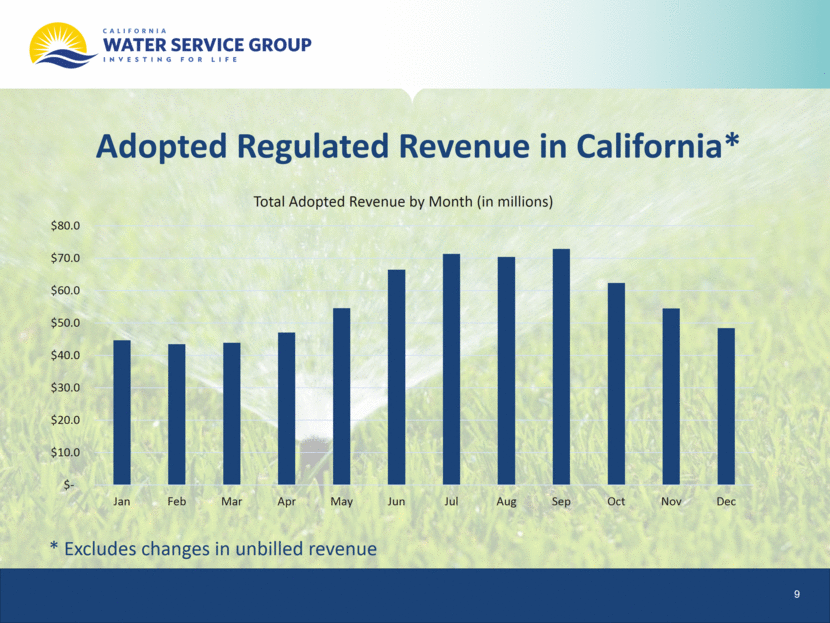
9 Adopted Regulated Revenue in California* * Excludes changes in unbilled revenue $- $10.0 $20.0 $30.0 $40.0 $50.0 $60.0 $70.0 $80.0 Jan Feb Mar Apr May Jun Jul Aug Sep Oct Nov Dec Total Adopted Revenue by Month (in millions)
10 EPS Bridge Q1 2018 to Q1 2019 *Reflects Q1 2018 results as disclosed in the first quarter 2019 Form 10-Q.
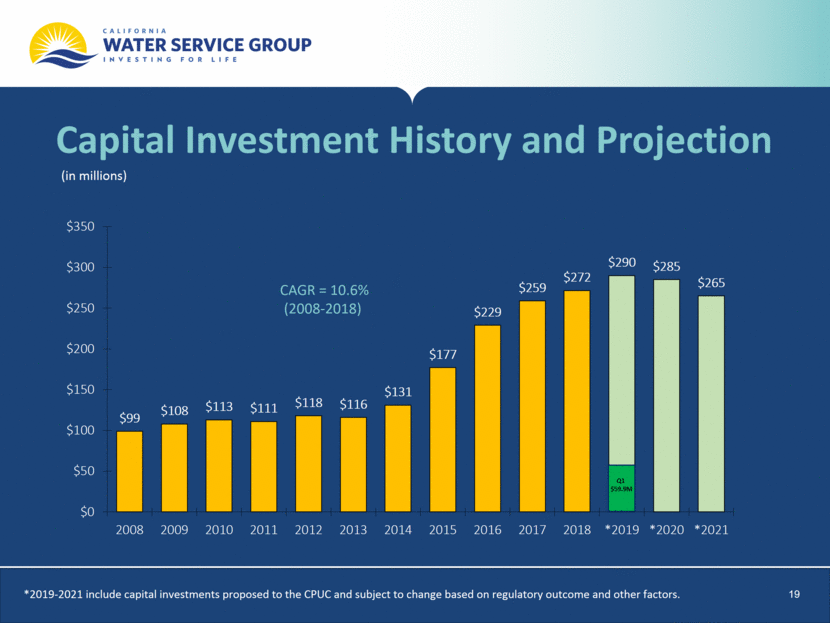
11 Capital Investment Update Company and developer funded capital investments were $59.9 million, a decrease of 15.3% compared to the first quarter of 2018 The decrease in utility plant investment was due to delays caused in part by wetter than normal weather 2019 capital spending levels are pending regulatory developments and we will provide more clarity on targets later in the year Projections of cap ex through 2021 shown later in these slides reflect the full $828.5 million request and timing proposed in the California GRC
12 2018 California General Rate Case Cal Water filed its 2018 GRC on July 2, 2018, requesting $828.5 million in capital investments over the period 2019-2021 Three municipalities and the California Public Advocates Office (Cal PA) are participating in the case Cal PA testimony was received on February 22, 2019 and Cal Water filed its rebuttal testimony on April 23, 2019 Cal Water anticipates beginning settlement discussions in May
In February 2019, Hawaii Water filed a GRC for its Kona service area requesting a combined increase of $0.6 million in water and wastewater rates. The company anticipates any rate changes approved by the Hawaii Public Utilities Commission would be effective in the first quarter of 2020 The CPUC has approved advice letter projects totaling additional $7.0 million of annual revenue out of authorization of up to $30 million through 2019 Advice letters seeking $0.2 million increased annual revenue were approved in April 2019 The bulk of remaining advice letter filings will be near the end of the year as we complete several large projects 13 Other Regulatory Items in Q1 2019
14 Financing Activities Company renewed and extended its revolving credit lines during the quarter Cal Water credit line is now $400 million, up from $300 million Standard and Poors recently changed Cal Waters outlook to Stable, reaffirming its A+ rating
15 Business Development Activities We maintain an active business development approach focusing on opportunities near communities we serve In the quarter, the Company announced it would acquire the Kalaeoloa Water Company on the island of Oahu, which serves an area formerly part of the Barbers Point Naval Air Station The acquisition is subject to approval of the Hawaii Public Utilities Commission
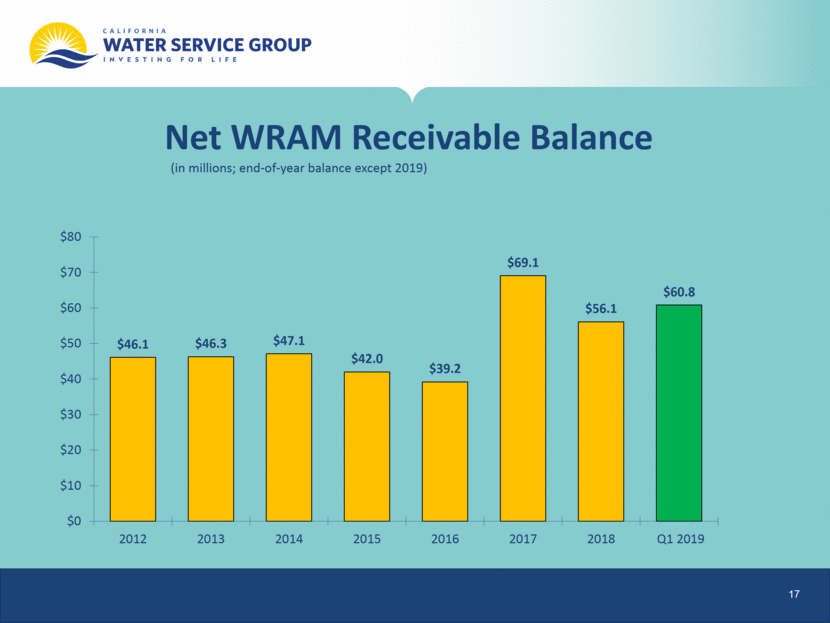
16 Decoupling Balancing Account Update Cal Water Q1 2019 sales were 83% of adopted estimates. Cal Waters adopted sales continue to benefit from the Sales Reconciliation Mechanism (SRM), which allows for a true-up when annual sales are above or below adopted sales by more than 5%. The SRM triggered for 2019 in most districts. By including lower sales estimates in base rates, the SRM reduced the Q1 2019 WRAM/MCBA balance by $2.3 million. The net WRAM receivable balance is $60.8 million, up from $56.1 million at year end 2018.
17 Net WRAM Receivable Balance (in millions; end-of-year balance except 2019)
18 Outlook for the Remainder of 2019 Major effort for the Company in 2019 will be the successful completion of the California GRC. We launched our Southern California regional call center this week to extend service hours and channels to better align our services to customer preferences. Training for Emergency Operations Centers is being conducted in advance of fire season, including four community drills with local agencies so far 2019 planned capital investment will be dependent on timing of regulatory approval for the Companys request for $828.5 million of new capital in California between 2019 and 2021. Rate increases in California, Hawaii, and Washington, offset by increased depreciation and interest costs, should provide the Company an opportunity to earn near its authorized return on equity in 2019 despite wet weather in the first quarter. The third year of the GRC cycle in California usually generates the largest gap in cost recovery. We refined our estimate of 2019 effective tax rate and now estimate it to be 22%.
19 Capital Investment History and Projection (in millions) *2019-2021 include capital investments proposed to the CPUC and subject to change based on regulatory outcome and other factors. CAGR = 10.6% (2008-2018) $99 $108 $113 $111 $118 $116 $131 $177 $229 $259 $272 $290 $285 $265 $0 $50 $100 $150 $200 $250 $300 $350 2008 2009 2010 2011 2012 2013 2014 2015 2016 2017 2018 *2019 *2020 *2021 Q1 $59.9M
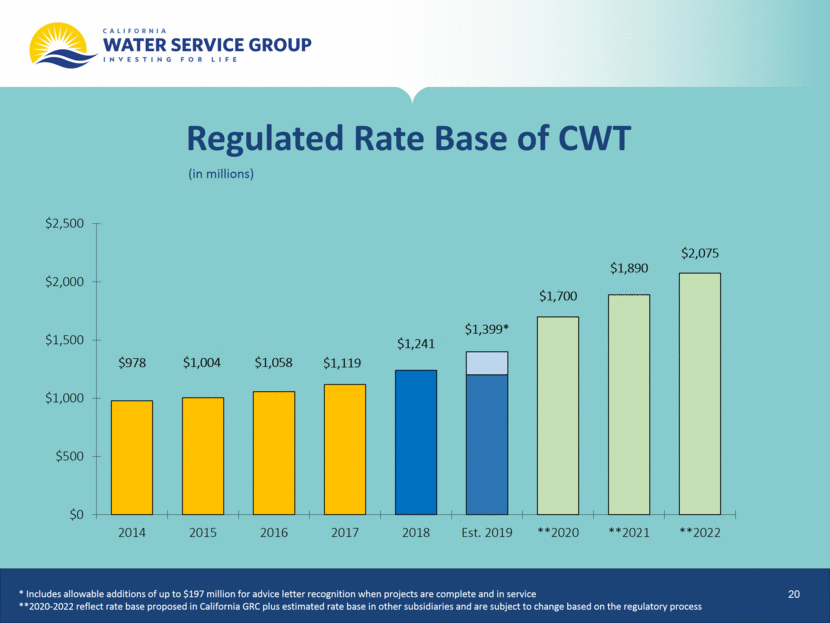
20 Regulated Rate Base of CWT (in millions) * Includes allowable additions of up to $197 million for advice letter recognition when projects are complete and in service **2020-2022 reflect rate base proposed in California GRC plus estimated rate base in other subsidiaries and are subject to change based on the regulatory process $978 $1,004 $1,058 $1,241 $1,119 $ 1,399* $1,700 $1,890 $2,075 $0 $500 $1,000 $1,500 $2,000 $2,500 2014 2015 2016 2017 2018 Est. 2019 **2020 **2021 **2022
21 Summary Increased operating expenses were not offset by rate increases Third year of the California GRC limits revenue increases This is mainly a timing issue as volumetric revenues move more of the Companys net income to the warm summer months Unbilled revenue lower due to wet weather through March Focused on safety and emergency response training Looking forward to settlement discussions in the California GRC beginning in May
For Additional Information: Thomas F. Smegal Vice President, Chief Financial Officer (408) 367-8200 or tsmegal@calwater.com Online at www.calwatergroup.com
