EXHIBIT 99.2
Published on October 31, 2019
Exhibit 99.2
Third Quarter 2019 Earnings Call Presentation October 31, 2019
Forward - Looking Statements 2 This presentation contains forward - looking statements within the meaning established by the Private Securities Litigation Reform Act of 1995 ("Act"). The forward - looking statements are intended to qualify under provisions of the federal securities laws for "safe harbor" treatme nt established by the Act. Forward - looking statements are based on currently available information, expectations, estimates, assumptions and projections, a nd management's judgment about the Company, the water utility industry and general economic conditions. Such words as would, expects, intends, plans, believes, estimates, assumes, anticipates, projects, predicts, forecasts or var iat ions of such words or similar expressions are intended to identify forward - looking statements. The forward - looking statements are not guarantees of fu ture performance. They are subject to uncertainty and changes in circumstances. Actual results may vary materially from what is contained in a forwa rd - looking statement. Factors that may cause a result different than expected or anticipated include, but are not limited to: ability to invest or app ly the proceeds from the issuance of common stock in an accretive manner; governmental and regulatory commissions' decisions, including decisions on p rop er disposition of property; consequences of eminent domain actions relating to our water systems; changes in regulatory commissions' policies a nd procedures; the timeliness of regulatory commissions' actions concerning rate relief and other actions; increased risk of inverse condemnatio n l osses as a result of climate conditions; inability to renew leases to operate water systems owned by others on beneficial terms; changes in Califo rni a State Water Resources Control Board water quality standards; changes in environmental compliance and water quality requirements; electric power int err uptions, especially as a result of Public Safety Power Shutoff programs for the 2019 fire season as we further develop approaches to manage that ris k; housing and customer growth trends; the impact of opposition to rate increases; our ability to recover costs; availability of water suppl ies ; issues with the implementation, maintenance or security of our information technology systems; civil disturbances or terrorist threats or act s; the adequacy of our efforts to mitigate physical and cyber security risks and threats; the ability of our enterprise risk management processes to id entify or address risks adequately; labor relations matters as we negotiate with unions; changes in customer water use patterns and the effects of co nse rvation; the impact of weather, climate, natural disasters, and diseases on water quality, water availability, water sales and operating results, an d t he adequacy of our emergency preparedness; and, other risks and unforeseen events. When considering forward - looking statements, you should keep in mind the cautionary statements included in this paragraph, as we ll as the annual 10 - K, Quarterly 10 - Q, and other reports filed from time - to - time with the Securities and Exchange Commission (SEC). The Company assu mes no obligation to provide public updates of forward - looking statements.
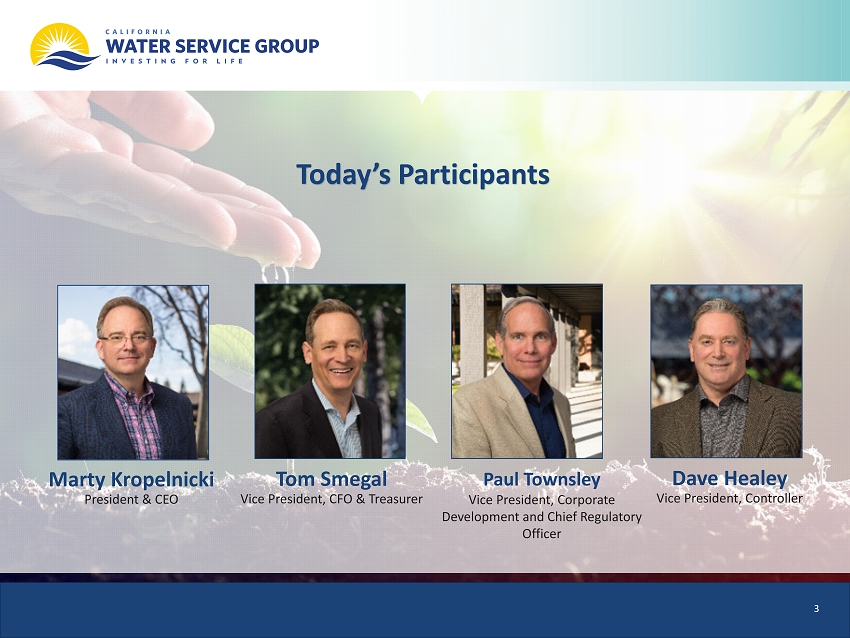
Today’s Participants Marty Kropelnicki President & CEO Tom Smegal Vice President, CFO & Treasurer Paul Townsley Vice President , Corporate Development and Chief Regulatory Officer Dave Healey Vice President, Controller 3
Presentation Overview • Our Operating Priorities • Financial Results, Third Quarter and YTD • Financial Highlights • EPS Bridge, T hird Quarter and YTD • 2018 California General Rate Case (GRC) • Capital Investment Update • Market Equity Program • Wildfires and Public Safety Power Shutoffs (PSPS) • Update on Perfluorinated Compounds • Decoupling Balancing Account Update • Cap Ex 2008 Recorded to 2021 Projected • Rate Base 2014 Recorded to 2022 P rojected • Summary 4
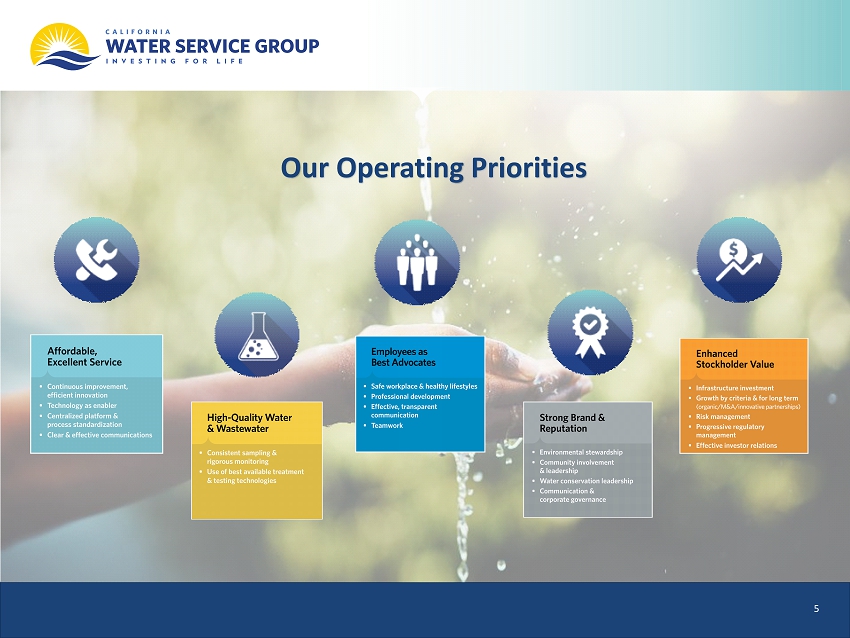
Our Operating Priorities 5
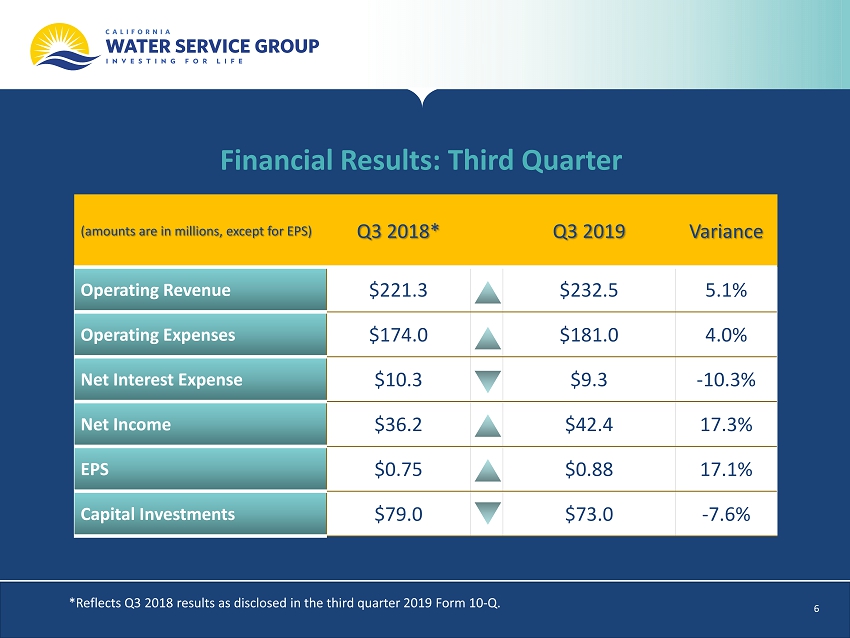
Financial Results: Third Quarter (amounts are in millions, except for EPS) Q3 2018* Q3 2019 Variance Operating Revenue $221.3 $232.5 5.1% Operating Expenses $174.0 $181.0 4.0% Net Interest Expense $10.3 $9.3 - 10.3% Net In come $36.2 $42.4 17.3% EPS $0.75 $0.88 17.1% Capital Investments $79.0 $73.0 - 7.6% *Reflects Q3 2018 results as disclosed in the third quarter 2019 Form 10 - Q. 6
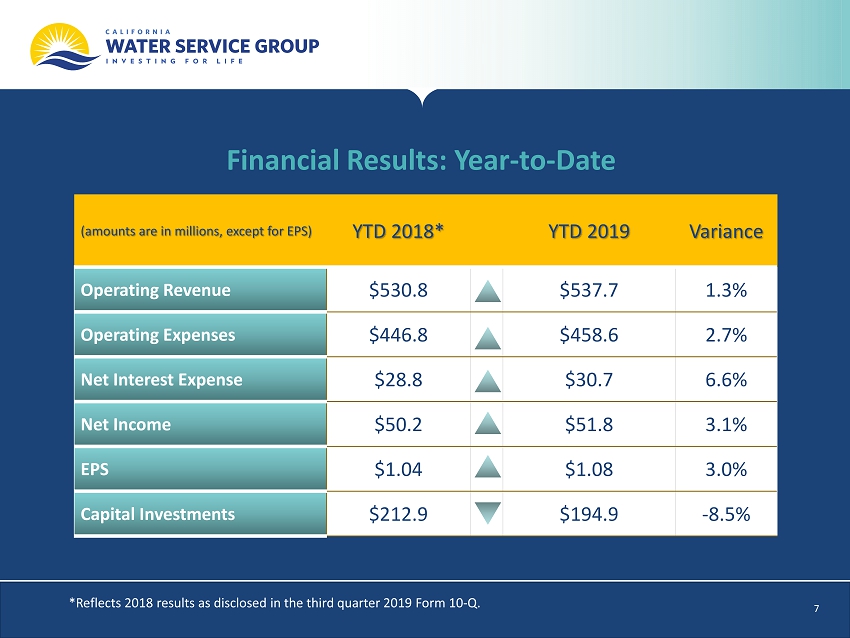
Financial Results: Year - to - Date (amounts are in millions, except for EPS) YTD 2018* YTD 2019 Variance Operating Revenue $530.8 $537.7 1.3% Operating Expenses $446.8 $458.6 2.7% Net Interest Expense $28.8 $30.7 6.6% Net Income $50.2 $51.8 3.1% EPS $1.04 $1.08 3.0% Capital Investments $212.9 $194.9 - 8.5% * Reflects 2018 results as disclosed in the third quarter 2019 Form 10 - Q. 7
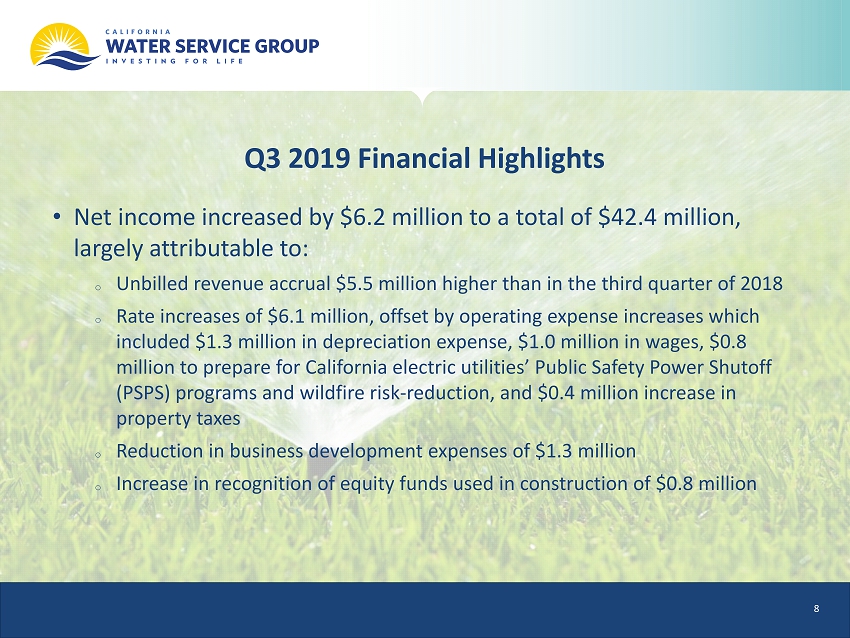
Q3 2019 Financial Highlights • Net income increased by $6.2 million to a total of $42.4 million, largely attributable to: o Unbilled revenue accrual $ 5.5 million higher than in the third quarter of 2018 o Rate increases of $6.1 million, offset by operating expense increases which included $1.3 million in depreciation expense, $1.0 million in wages, $0.8 million to prepare for California electric utilities’ Public Safety Power Shutoff (PSPS) programs and wildfire risk - reduction, and $0.4 million increase in property taxes o Reduction in business development expenses of $1.3 million o Increase in recognition of equity funds used in construction of $0.8 million 8
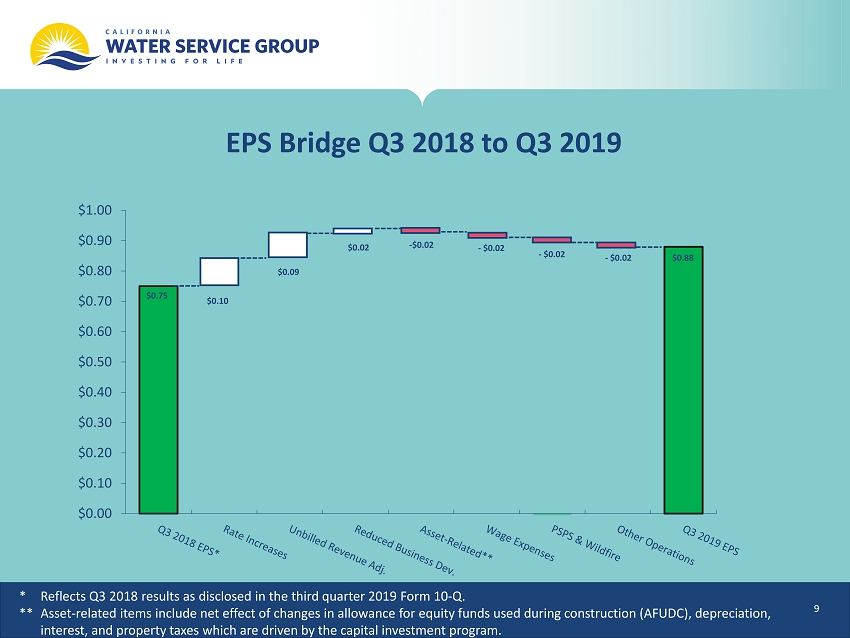
EPS Bridge Q3 2018 to Q3 2019 * Reflects Q3 2018 results as disclosed in the third quarter 2019 Form 10 - Q . ** Asset - related items include net effect of changes in a llowance for equity funds used during construction (AFUDC), depreciation, interest, and property t axes which are driven by the capital investment program. $0.00 $0.10 $0.20 $0.30 $0.40 $0.50 $0.60 $0.70 $0.80 $0.90 $1.00 - $0.02 - $ 0.02 $0.75 $ 0.09 $0.02 - $ 0.02 - $ 0.02 $0.10 $0.88 9
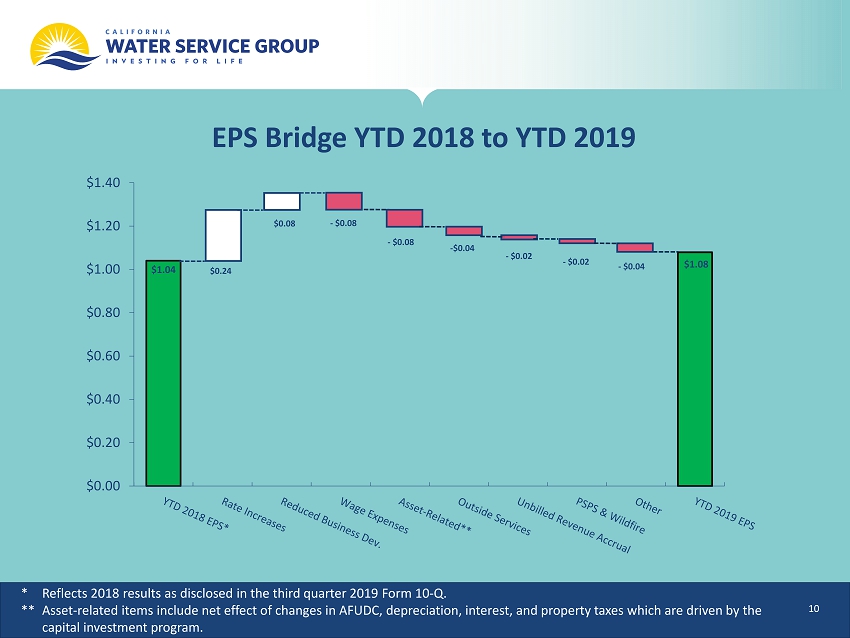
EPS Bridge YTD 2018 to YTD 2019 * Reflects 2018 results as disclosed in the third quarter 2019 Form 10 - Q. ** Asset - related items include net effect of changes in AFUDC, depreciation , interest , and property t axes which are driven by the capital investment program. $1.04 $0.24 $0.08 $1.08 $0.00 $0.20 $0.40 $0.60 $0.80 $1.00 $1.20 $1.40 - $ 0.08 - $ 0.08 - $0.04 - $ 0.02 - $ 0.02 - $ 0.04 10
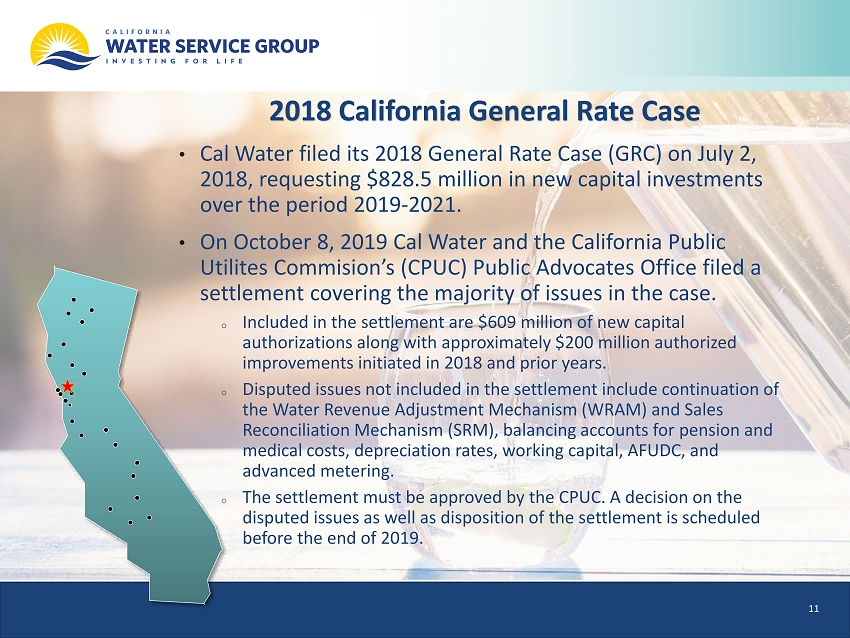
2018 California General Rate Case • Cal Water filed its 2018 General Rate Case (GRC) on July 2 , 2018, requesting $828.5 million in new capital investments over the period 2019 - 2021. • On October 8, 2019 Cal Water and the California Public Utilites Commision’s (CPUC) Public Advocates Office filed a settlement covering the majority of issues in the case. o Included in the settlement are $609 million of new capital authorizations along with approximately $200 million authorized improvements initiated in 2018 and prior years. o Disputed issues not included in the settlement include continuation of the Water Revenue Adjustment Mechanism (WRAM) and Sales Reconciliation Mechanism (SRM), balancing accounts for pension and medical costs, depreciation rates, working capital, AFUDC, and advanced metering. o The settlement must be approved by the CPUC. A decision on the disputed issues as well as disposition of the settlement is scheduled before the end of 2019. 11
Capital Investment Update • Year - to - date company and developer - funded capital investments were $194.9 million, a decrease of 8.5% compared to 2018 • The Company now estimates 2019 capital spending levels between $250 and $260 million for 2019 with higher capital spending in 2020 and 2021 anticipated after approval of the GRC settlement o CapEx and Rate Base Projections shown later in these slides have been updated to reflect the projected effects if the settlement were approved • As discussed below, the Company filed a registration statement this morning with the Securities and Exchange Commission (SEC) for $300 million of common stock to be issued in “at the market” offerings 12
• The Company has signed an equity distribution agreement and filed a registration statement with the SEC this morning • We have identified $806 million or more of capital improvements covered by the proposed partial rate case settlement in California through 2021 • Management plans to maintain a balanced equity structure consistent with regulatory authorizations and has chosen the market equity approach • The program is expected to generate up to $300 million of new equity over approximately three years • The Company or its operating subsidiaries may also issue new long - term debt from time to time as another source of funding Market Equity Approach 13
• Cal Water’s preparations for Public Safety Power Shutoffs (PSPS) and wildfires in its systems have been effective so far o Multiple PSPS have affected our service areas but we have been able to operate with backup electric generation o To date, Cal Water has spent $0.5 million on readiness for PSPS and an additional $0.6 million on wildfire prevention efforts o We still anticipate approximately $2 million total expenditure for 2019 with the bulk of the remaining amount related to PSPS o We will seek regulatory recovery in a future filing for the PSPS expenses and operating expenses related to declared wildfire emergencies • M ajor PSPS event in the last week with 62 water pumping stations without grid power for 1 - 5 days o All customers remained in water service for the duration of the event o Cal Water coordinated efforts through a 24 - hour Emergency Operations Center o Communication with electric utilities has improved since the beginning of the year Wildfires and Public Safety Power Shutoffs 14
Update on Perfluorinated Compounds • PFOS and PFOA, among other related compounds, have received significant regulatory and media attention in 2019. • The US Environmental Protection Agency (EPA) required utilities to sample for these chemicals between 2013 and 2015; however, testing methodologies have improved and the EPA will require repeat testing in 2022 - 2026. o California has required additional testing in 2019 in some areas based on the 2015 test results and proximity to likely contamination sources. • California has set notification levels of 5.1 - 6.5 parts per trillion. A notification level is not an enforceable water quality standard but complying with the regulation requires notifying customers about the presence of the chemical. • Of the Company’s hundreds of active wells, around 30 have tested above the notification level. • As regulations around these compounds evolve, the Company anticipates it will be able to construct and operate treatment systems to be in compliance with future MCL requirements with the support and assistance of its regulators. 15
Decoupling Balancing Account Update • Cal Water Q3 2019 sales were 84% of adopted estimates • The net WRAM receivable balance is $62.6 million, up from $56.1 million at year - end 2018 • Change in adopted sales due to triggering the SRM, which allows for a true - up when annual sales are above or below adopted sales by more than 5% • Had the SRM not been in place, lowering sales estimates in base rates, the WRAM/MCBA balance would have been $11.0 million higher at the end of Q3 16
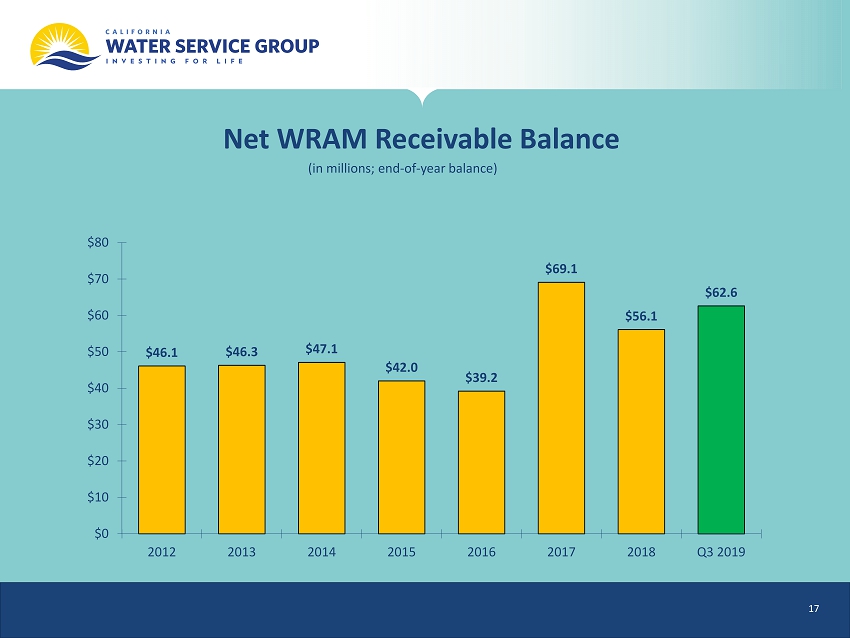
Net WRAM Receivable Balance (in millions; end - of - year balance) $46.1 $46.3 $47.1 $42.0 $39.2 $69.1 $56.1 $62.6 $0 $10 $20 $30 $40 $50 $60 $70 $80 2012 2013 2014 2015 2016 2017 2018 Q3 2019 17
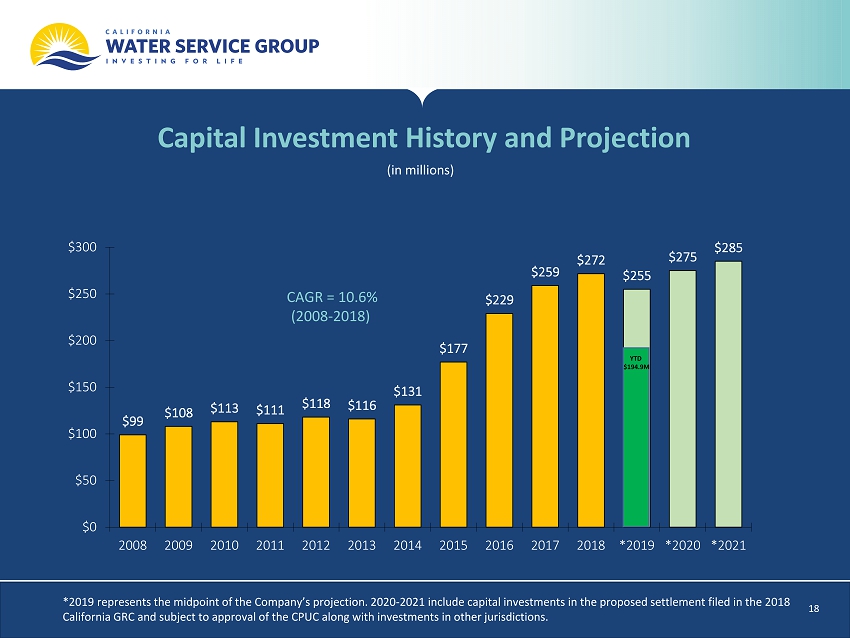
Capital Investment History and Projection (in millions) * 2019 represents the midpoint of the Company’s projection. 2020 - 2021 include capital investments in the proposed settlement filed in the 2018 California GRC and subject to approval of the CPUC along with investments in other jurisdictions. $99 $108 $113 $111 $118 $116 $131 $177 $229 $259 $272 $255 $275 $285 $0 $50 $100 $150 $200 $250 $300 2008 2009 2010 2011 2012 2013 2014 2015 2016 2017 2018 *2019 *2020 *2021 YTD $194.9M CAGR = 10.6% (2008 - 2018) 18
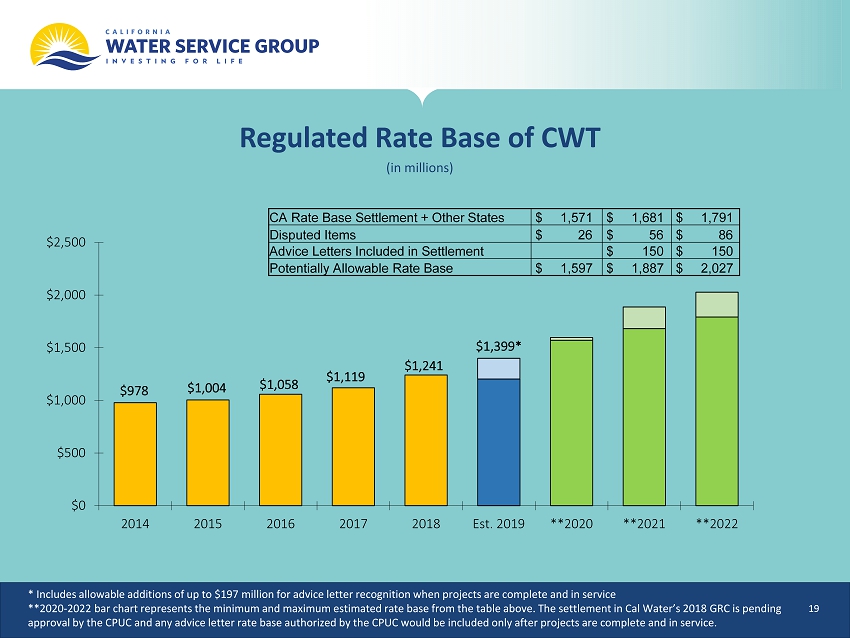
Regulated Rate Base of CWT (in millions) * Includes allowable additions of up to $197 million for advice letter recognition when projects are complete and in service ** 2020 - 2022 bar chart represents the minimum and maximum estimated rate base from the table above. The settlement in Cal Water’s 2018 GRC is pending approval by the CPUC and any advice letter rate base authorized by the CPUC would be included only after projects are complet e a nd in service. $978 $1,004 $1,058 $1,241 $1,119 $ 1,399* $0 $500 $1,000 $1,500 $2,000 $2,500 2014 2015 2016 2017 2018 Est. 2019 **2020 **2021 **2022 CA Rate Base Settlement + Other States $ 1,571 $ 1,681 $ 1,791 Disputed Items $ 26 $ 56 $ 86 Advice Letters Included in Settlement $ 150 $ 150 Potentially Allowable Rate Base $ 1,597 $ 1,887 $ 2,027 19
Wrapping Up • Company focus is on concluding the California GRC and ensuring the settlement is adopted by the CPUC • Equity issuances are expected to help finance anticipated capital improvements • Wildfire season still underway in California with multiple PSPS already this fall 20
Discussion