EXHIBIT 99.2
Published on July 30, 2020
Exhibit 99.2
Second Quarter 2020 Results Call Presentation July 30, 2020
Forward - Looking Statements This presentation contains forward - looking statements within the meaning established by the Private Securities Litigation Refor m Act of 1995 ("Act"). The forward - looking statements are intended to qualify under provisions of the federal securities laws for "safe harbor" treatme nt established by the Act. Forward - looking statements are based on currently available information, expectations, estimates, assumptions and projectio ns, and management's judgment about the Company, the water utility industry and general economic conditions. Such words as would, expects, intends, plans, believes, estimates, assumes, anticipates, projects, predicts, forecasts or var iat ions of such words or similar expressions are intended to identify forward - looking statements. The forward - looking statements are not guarantees of fu ture performance. They are subject to uncertainty and changes in circumstances. Actual results may vary materially from what is contained in a for ward - looking statement. Factors that may cause a result different than expected or anticipated include, but are not limited to: ability to invest or app ly the proceeds from the issuance of common stock in an accretive manner; governmental and regulatory commissions' decisions; natural disasters or cal ami ties, epidemics, pandemics or disease outbreaks (including COVID - 19) or any escalation or worsening of, or economic effects of, the foregoing; co nsequences of eminent domain actions relating to our water systems; changes in regulatory commissions' policies and procedures; the outcome an d timeliness of regulatory commissions' actions concerning rate relief and other actions, including with respect to the GRC; increased risk o f i nverse condemnation losses as a result of climate conditions; inability to renew leases to operate water systems owned by others on beneficial te rms ; changes in California State Water Resources Control Board water quality standards; changes in environmental compliance and water quality requiremen ts; electric power interruptions, especially as a result of Public Safety Power Shutoff programs for the 2020 fire season as we further develop app roaches to manage that risk; the impact of opposition to rate increases; our ability to recover costs; availability of water supplies; issues with t he implementation, maintenance or security of our information technology systems; civil disturbances or terrorist threats or acts, or apprehension about the po ssible future occurrences of acts of this type; the adequacy of our efforts to mitigate physical and cyber security risks and threats; the ability of o ur enterprise risk management framework to identify or address risks adequately; labor relations matters as we negotiate with unions; changes in customer w ate r use patterns and the effects of conservation; our ability to complete, successfully intergrate and achieve anticipated benefits from announced acquisitions; the impact weather, and climate on water quality, water availability, water sales and operating results, and the adequacy of our emergen cy preparedness; and, other risks and unforeseen events. When considering forward - looking statements, you should keep in mind the cautionary statements included in this paragraph, as we ll as the annual 10 - K, Quarterly 10 - Q, and other reports filed from time - to - time with the Securities and Exchange Commission (SEC). The Company a ssumes no obligation to provide public updates of forward - looking statements. 2
Today’s Participants Marty Kropelnicki President & CEO Tom Smegal Vice President, CFO & Treasurer Dave Healey Vice President, Controller 3
Presentation Overview • Our Operating Priorities • Financial Results, Q2 and YTD • Financial Highlights, Q2 and YTD • Effects of the delayed California General Rate Case (“GRC”) • EPS Bridges • Updated COVID - 19 Impacts • California Regulatory Update • Capital Investment Update • Business Development Update • Cap Ex 2008 Recorded to 2021 Projected • Rate Base 2014 Recorded to 2022 Projected • Wrapping Up and Look Ahead 4
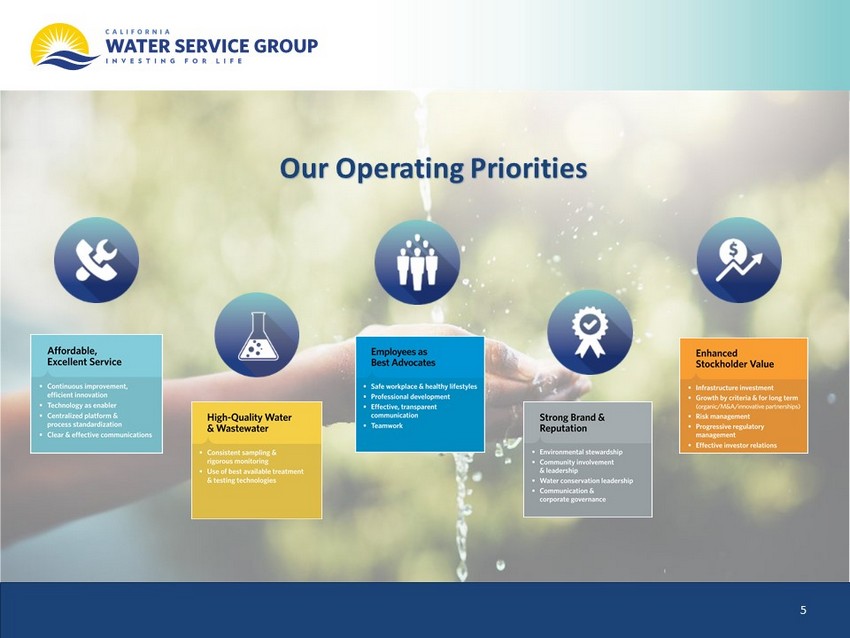
Our Operating Priorities 5
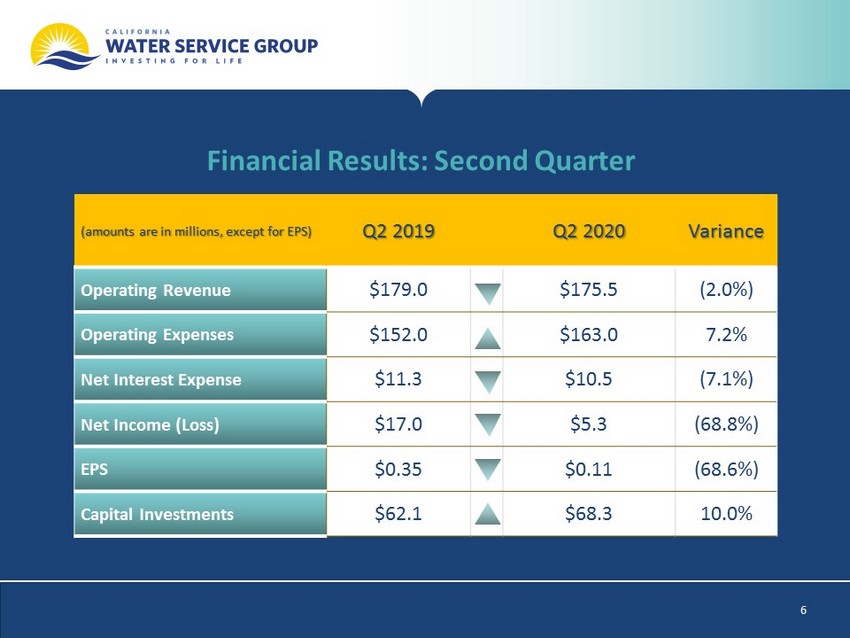
Financial Results: Second Quarter (amounts are in millions, except for EPS) Q2 2019 Q2 2020 Variance Operating Revenue $179.0 $175.5 (2.0%) Operating Expenses $152.0 $163.0 7.2% Net Interest Expense $11.3 $10.5 (7.1%) Net In come (Loss) $17.0 $5.3 (68.8%) EPS $0.35 $0.11 (68.6%) Capital Investments $62.1 $68.3 10.0% 6
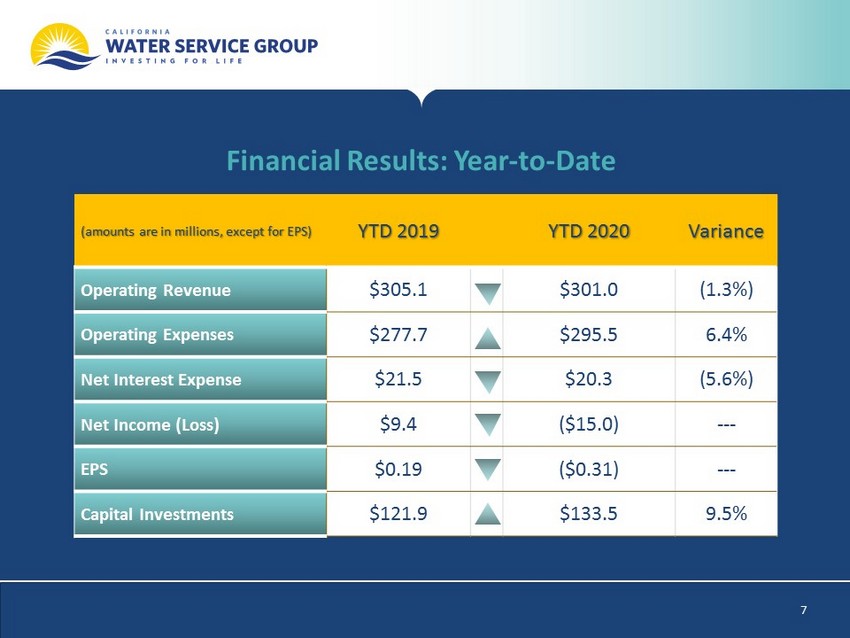
Financial Results: Year - to - Date (amounts are in millions, except for EPS) YTD 2019 YTD 2020 Variance Operating Revenue $305.1 $301.0 (1.3%) Operating Expenses $277.7 $295.5 6.4% Net Interest Expense $21.5 $20.3 (5.6%) Net In come (Loss) $9.4 ($15.0) --- EPS $0.19 ($0.31) --- Capital Investments $121.9 $133.5 9.5% 7
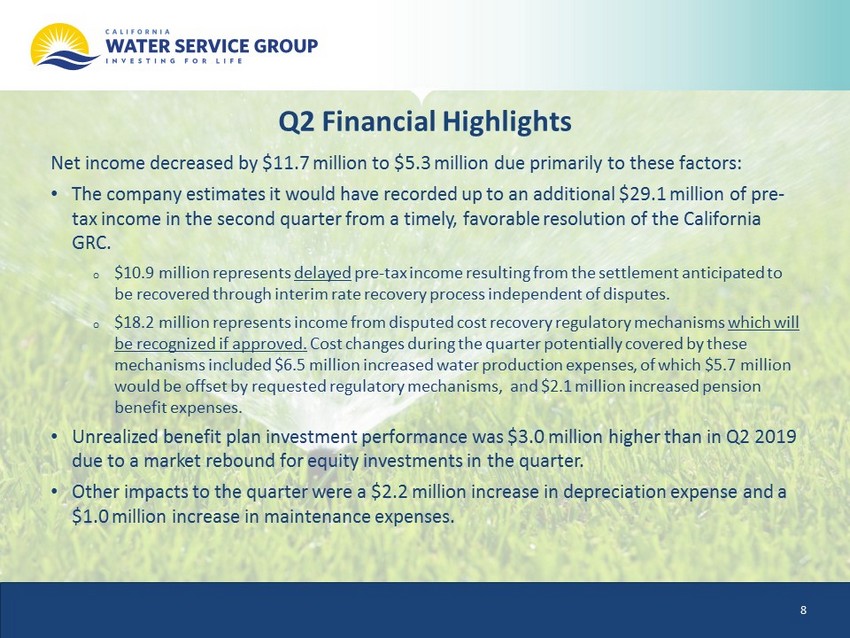
Q2 Financial Highlights Net income decreased by $11.7 million to $5.3 million due primarily to these factors: • The company estimates it would have recorded up to an additional $29.1 million of pre - tax income in the second quarter from a timely, favorable resolution of the California GRC. o $10.9 million represents delayed pre - tax income resulting from the settlement anticipated to be recovered through interim rate recovery process independent of disputes. o $18.2 million represents income from disputed cost recovery regulatory mechanisms which will be recognized if approved. Cost changes during the quarter potentially covered by these mechanisms included $6.5 million increased water production expenses, of which $5.7 million would be offset by requested regulatory mechanisms, and $2.1 million increased pension benefit expenses. • Unrealized benefit plan investment performance was $3.0 million higher than in Q2 2019 due to a market rebound for equity investments in the quarter . • Other impacts to the quarter were a $2.2 million increase in depreciation expense and a $1.0 million increase in maintenance expenses. 8
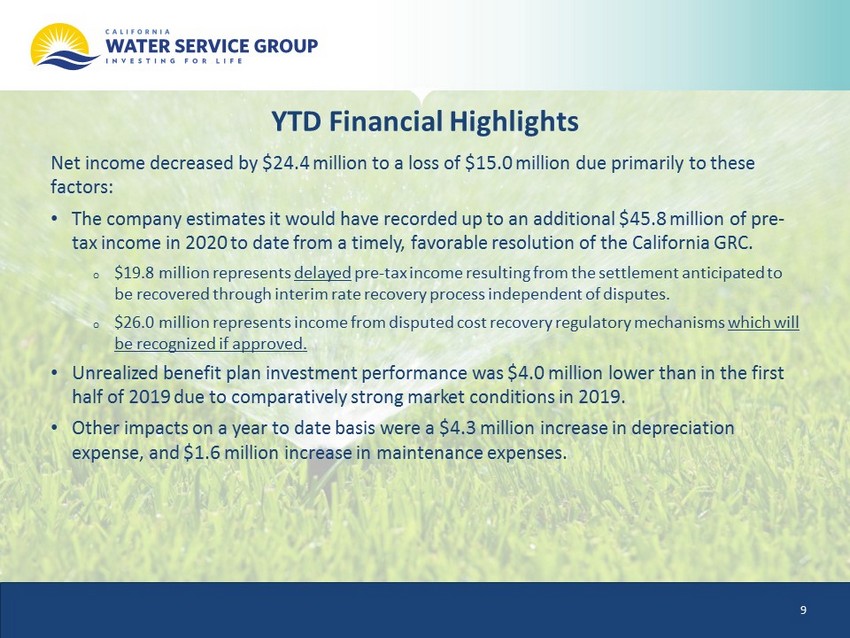
YTD Financial Highlights Net income decreased by $24.4 million to a loss of $15.0 million due primarily to these factors: • The company estimates it would have recorded up to an additional $45.8 million of pre - tax income in 2020 to date from a timely, favorable resolution of the California GRC. o $19.8 million represents delayed pre - tax income resulting from the settlement anticipated to be recovered through interim rate recovery process independent of disputes. o $26.0 million represents income from disputed cost recovery regulatory mechanisms which will be recognized if approved. • Unrealized benefit plan investment performance was $4.0 million lower than in the first half of 2019 due to comparatively strong market conditions in 2019 . • Other impacts on a year to date basis were a $4.3 million increase in depreciation expense, and $1.6 million increase in maintenance expenses. 9
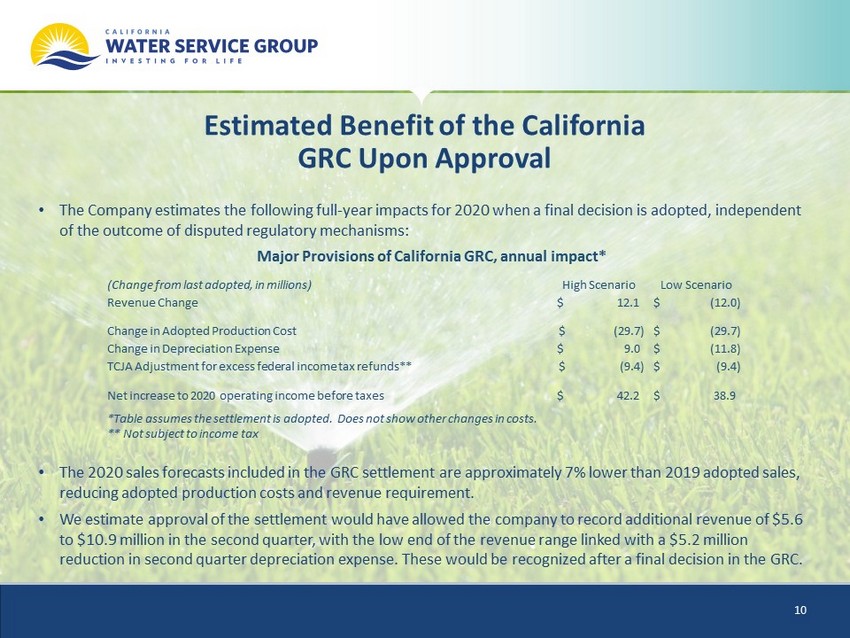
Estimated Benefit of the California GRC Upon Approval • The Company estimates the following full - year impacts for 2020 when a final decision is adopted, independent of the outcome of disputed regulatory mechanisms: • The 2020 sales forecasts included in the GRC settlement are approximately 7% lower than 2019 adopted sales, reducing adopted production costs and revenue requirement. • We estimate approval of the settlement would have allowed the company to record additional revenue of $5.6 to $10.9 million in the second quarter, with the low end of the revenue range linked with a $5.2 million reduction in second quarter depreciation expense. These would be recognized after a final decision in the GRC. (Change from last adopted, in millions) High Scenario Low Scenario Revenue Change 12.1 $ (12.0) $ Change in Adopted Production Cost (29.7) $ (29.7) $ Change in Depreciation Expense 9.0 $ (11.8) $ TCJA Adjustment for excess federal income tax refunds** (9.4) $ (9.4) $ Net increase to 2020 operating income before taxes 42.2 $ 38.9 $ *Table assumes the settlement is adopted. Does not show other changes in costs. ** Not subject to income tax Major Provisions of California GRC, annual impact* 10
Potential Impact of Disputed GRC Items in Q2 • As shown on the previous slide, the depreciation dispute is a “pass - through” expense affecting both adopted revenue and expense. • We did not record the effect of the disputed 2020 WRAM/MCBA decoupling mechanism in the second quarter, consistent with Q1. Prevailing on this issue would allow us to record these accounts as we have in past periods, recognizing approximately $14.9 million of additional revenue for the quarter in accordance with GAAP. • We did not record the effect of disputed 2020 pension and medical cost balancing accounts in the quarter. Prevailing on this issue would allow us to record these accounts as we have in past periods, recognizing an additional $3.3 million of revenue in accordance with GAAP. • The Company is highly confident that past amounts properly recorded in balancing accounts continue to be recoverable from customers. • Other disputed items including capital projects, construction financing costs, and working capital requirements would not have had a significant impact in the quarter. 11
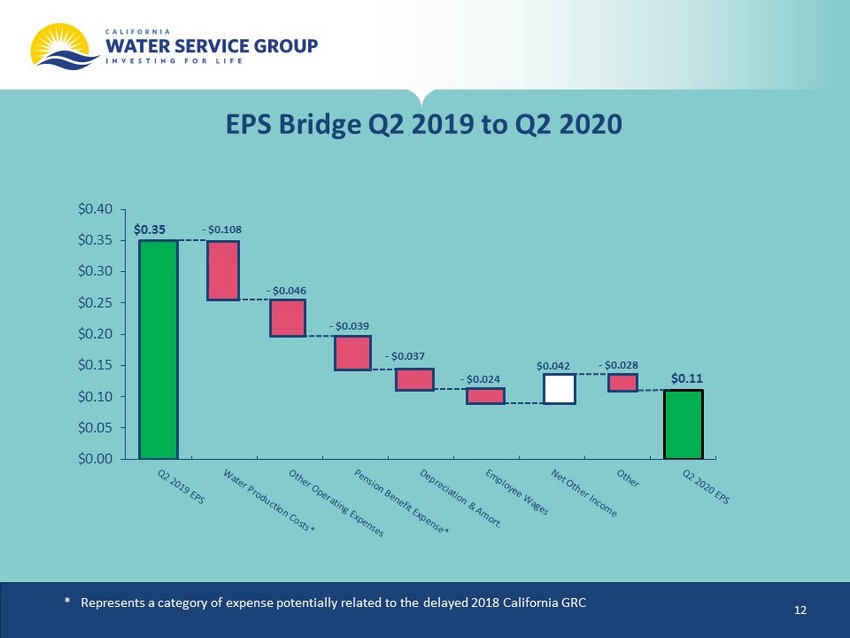
EPS Bridge Q2 2019 to Q2 2020 $0.00 $0.05 $0.10 $0.15 $0.20 $0.25 $0.30 $0.35 $0.40 - $0.039 - $0.024 $0.042 $0.35 - $0.046 - $0.037 - $0.108 $0.11 - $0.028 * Represents a category of expense potentially related to the delayed 2018 California GRC 12
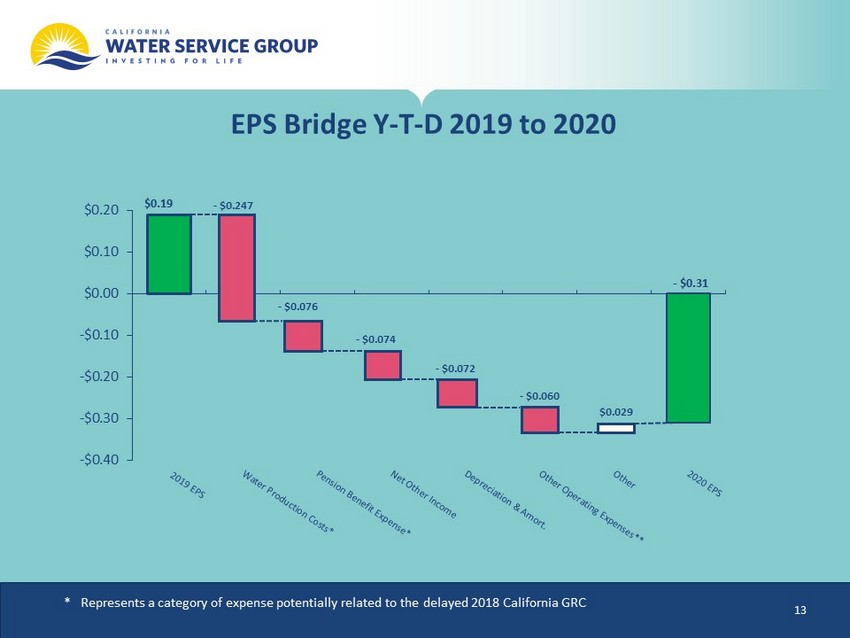
EPS Bridge Y - T - D 2019 to 2020 -$0.40 -$0.30 -$0.20 -$0.10 $0.00 $0.10 $0.20 - $0.074 - $0.060 $0.029 $0.19 - $0.076 - $0.072 - $0.247 - $0.31 * Represents a category of expense potentially related to the delayed 2018 California GRC 13
COVID - 19 Pandemic Update • The Company has continued its policies and practices to protect customers and employees during the pandemic. We are designated an essential business and most employees continue to work onsite and in our communities. We are complying with local regulations in our service areas as well as mandating masks and other personal protective equipment (PPE) for our employees. • California, and specifically in Kern and Los Angeles Counties where we operate, has seen increasing caseloads and hospitalizations in the past few months. Our customer centers in all states remain closed and collection activities are suspended. • We have offered additional help to our communities through a directed grant of $400,000 to customers who are struggling to pay bills. • To date, we have had no significant service disruption due to COVID - 19. 14
• We have seen increased customer account aging from the suspension of collection activity. o Bills outstanding more than 90 days increased to $3.4 million. Only a portion of such amounts are typically uncollectible. o The company has increased its reserve for doubtful accounts from $0.8 million to $1.6 million as of the second quarter. • Water sales in aggregate have been close to adopted levels, with increases in residential usage being offset by lower business, industrial, and public authority sales. • Our California utility (“Cal Water”) activated its catastrophic event memorandum account as authorized by the CPUC to track incremental costs and other impacts of the pandemic. o In Q2, we recorded approximately $0.6 million of incremental operating expenses to the memorandum account. o Additionally, Increases in estimated uncollectible expenses, including the recorded reserve for doubtful accounts, and potential lost revenue can be recorded in the memorandum account. o Like other memorandum accounts, recovery of the recorded amounts would occur in a future period after review. • Hawaii Water Service has also requested to track impacts of COVID on its costs and revenues. • Liquidity remains strong. As of June 30, we had $114 million of cash and additional current capacity of more than $170 million on lines of credit. Business Impacts from COVID - 19 Pandemic 15
California Regulatory Update • The CPUC extended its deadline for consideration of Cal Water’s 2018 GRC to September 30, 2020. o In order to meet this date, the Commission must issue a proposed decision by August 25. • On July 3, the CPUC issued an unexpected proposed decision in an unrelated policy case. If adopted, the decision would require Cal Water to propose removing its decoupling mechanism in the next GRC. o The decision is troubling, in that the Commission draws conclusions based on a cursory review of limited evidence. The Company and other interested groups are asking the CPUC to collect and review more evidence before making a policy decision in this area. We belive that a full review of the policy will allow the CPUC to reach a different conclusion. o It is unclear what effect a policy decision might have on the GRC resolution of related matters. 16
Q2 Capital Investment Update • Company and developer - funded capital investments were $133.5 million in the first half of 2020, an increase of 9.5% compared to the same period in 2019. • The Company has previously estimated it would spend $260 - 290 million on capital in 2020. • While the Company has experienced some individual project slowdowns related to COVID - 19, overall the capital program has been on track with our expectations. • We anticipate adding about $5 million incremental capital investment in 2021 in the expanded Washington service area (formerly Rainier View Water). 17
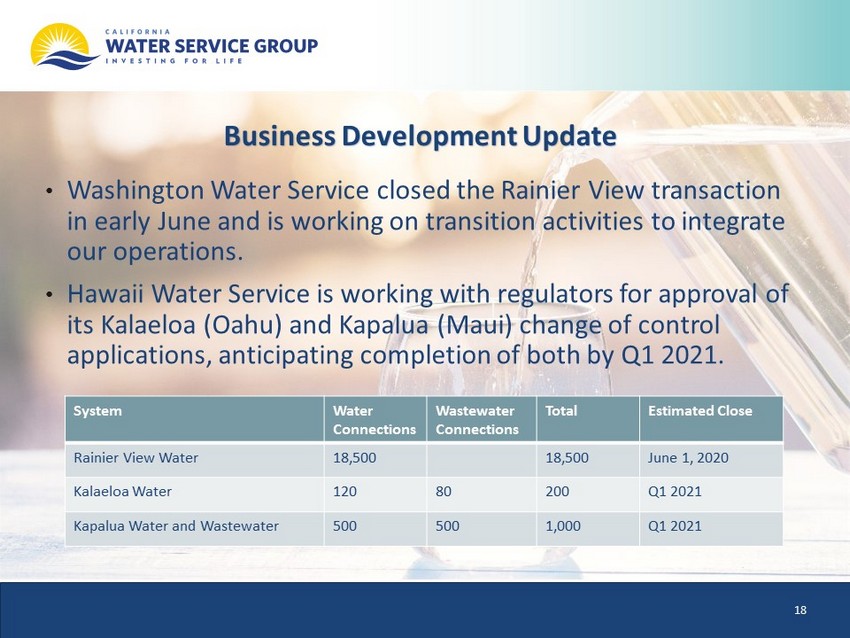
Business Development Update • Washington Water Service closed the Rainier View transaction in early June and is working on transition activities to integrate our operations. • Hawaii Water Service is working with regulators for approval of its Kalaeloa (Oahu) and Kapalua (Maui) change of control applications, anticipating completion of both by Q1 2021. System Water Connections Wastewater Connections Total Estimated Close Rainier View Water 18,500 18,500 June 1, 2020 Kalaeloa Water 120 80 200 Q1 2021 Kapalua Water and Wastewater 500 500 1,000 Q1 2021 18
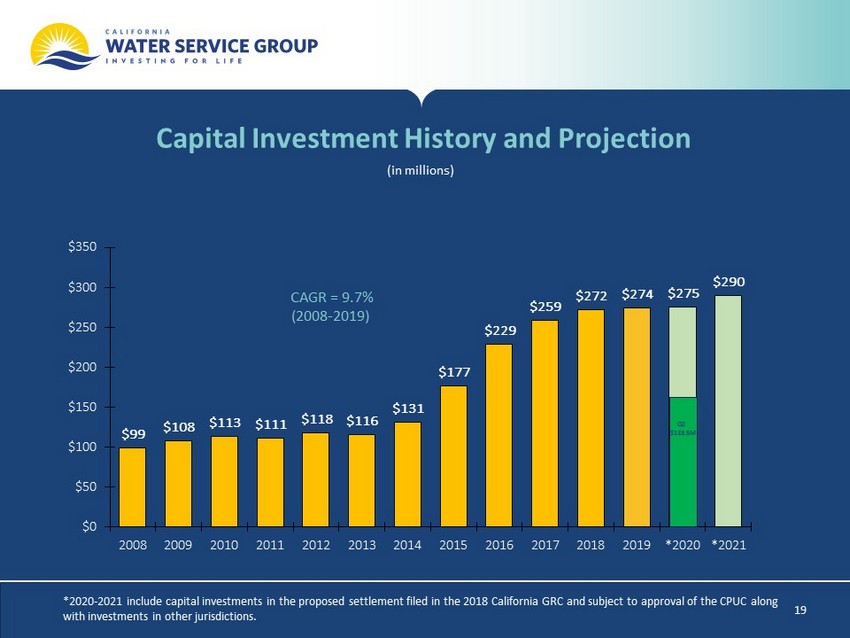
Capital Investment History and Projection (in millions) *2020 - 2021 include capital investments in the proposed settlement filed in the 2018 California GRC and subject to approval of th e CPUC along with investments in other jurisdictions. $99 $108 $113 $111 $118 $116 $131 $177 $229 $259 $272 $274 $275 $290 $0 $50 $100 $150 $200 $250 $300 $350 2008 2009 2010 2011 2012 2013 2014 2015 2016 2017 2018 2019 *2020 *2021 CAGR = 9.7% (2008 - 2019) Q2 $133.5M 19
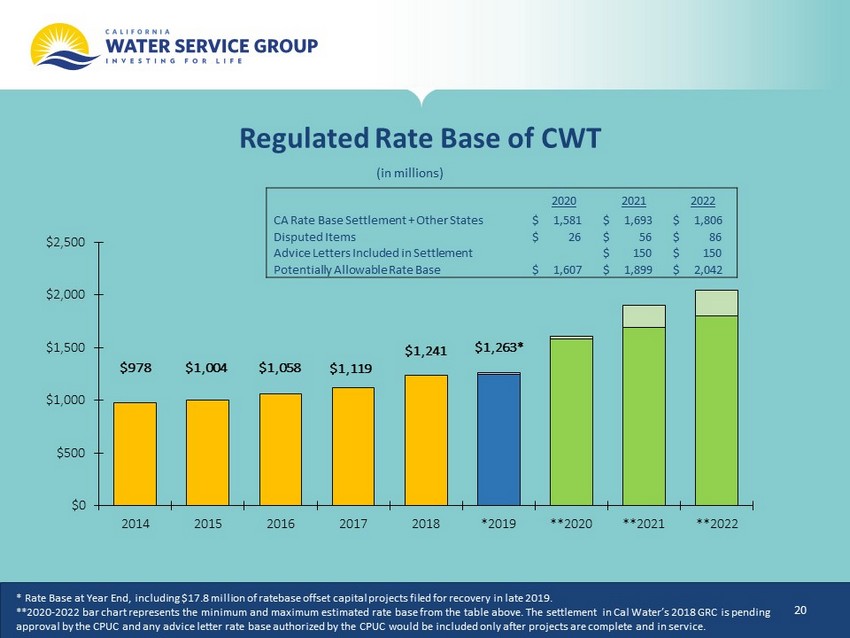
Regulated Rate Base of CWT (in millions) * Rate Base at Year End, including $17.8 million of ratebase offset capital projects filed for recovery in late 2019. **2020 - 2022 bar chart represents the minimum and maximum estimated rate base from the table above. The settlement in Cal Water’s 2018 GRC is pending approval by the CPUC and any advice letter rate base authorized by the CPUC would be included only after projects are complet e a nd in service. $978 $1,004 $1,058 $1,241 $1,119 $1,263* $0 $500 $1,000 $1,500 $2,000 $2,500 2014 2015 2016 2017 2018 *2019 **2020 **2021 **2022 2020 2021 2022 CA Rate Base Settlement + Other States $ 1,581 $ 1,693 $ 1,806 Disputed Items $ 26 $ 56 $ 86 Advice Letters Included in Settlement $ 150 $ 150 Potentially Allowable Rate Base $ 1,607 $ 1,899 $ 2,042 20
Wrapping Up and Look Ahead • Management will have a regulatory focus in the third quarter, working to modify or oppose the CPUC policy decision on decoupling and anticipating a GRC proposed decision this summer. • Company operators are providing a high level of service to our customers during COVID - 19 mitigation while keeping our employees safe. • While we concentrate on the current emergency, we have not lost focus on potential future wildfires and ongoing capital improvements. 21
Discussion 22