EXHIBIT 99.2
Published on November 6, 2020
Exhibit 99.2
Third Quarter 2020 Results Call Presentation November 6, 2020
Forward - Looking Statements This presentation contains forward - looking statements within the meaning established by the Private Securities Litigation Refor m Act of 1995 ("Act"). The forward - looking statements are intended to qualify under provisions of the federal securities laws for "safe harbor" treatment e stablished by the Act. Forward - looking statements are based on currently available information, expectations, estimates, assumptions and projections, a nd management's judgment about the Company, the water utility industry and general economic conditions. Such words as would, expects, intends, plans, believes, estimates, assumes, anticipates, projects, predicts, forecasts or var iat ions of such words or similar expressions are intended to identify forward - looking statements. The forward - looking statements are not guarantees of future per formance. They are subject to uncertainty and changes in circumstances. Actual results may vary materially from what is contained in a forward - look ing statement. Factors that may cause a result different than expected or anticipated include, but are not limited to: any failure by the CPUC to adopt the proposed decision as published; ability to invest or apply the proceeds from the issuance of common stock in an accretive manner; governmental and regulatory commissions' decisions; natural disasters or calamities, epidemics, pandemics or disease outbreaks (including COVID - 19) or any e scalation or worsening of, or economic effects of, the foregoing, including as a result of our suspension of collections activities; consequences of eminent domain actions relating to our water systems; changes in regulatory commissions' policies and procedures; the outcome and timeliness of regulatory commissions' actions concerning rate relief and other actions, including with respect to the GRC; increased risk of inverse condemnation losses as a result of climate conditions; inability to renew leases to operate water systems owned by others on beneficial terms; changes in California State Water Resources Contro l B oard water quality standards; changes in environmental compliance and water quality requirements; electric power interruptions, especially as a result of P ubl ic Safety Power Shutoff programs for the 2020 fire season as we further develop approaches to manage that risk; the impact of opposition to rate increases; our ability to recover costs; availability of water supplies; issues with the implementation, maintenance or security of our information tec hno logy systems; civil disturbances or terrorist threats or acts, or apprehension about the possible future occurrences of acts of this type; the adequacy of our efforts to mitigate physical and cyber security risks and threats; the ability of our enterprise risk management framework to identify or address ri sks adequately; labor relations matters as we negotiate with unions; changes in customer water use patterns and the effects of conservation; our ability to complete, successfully integrate and achieve anticipated benefits from announced acquisitions; the impact weather, and climate on water quality, water availability, water sales and operating results, and the adequacy of our emergency preparedness; and, other risks and unforeseen events. When considering forward - looking statements, you should keep in mind the cautionary statements included in this paragraph, as we ll as the annual 10 - K, Quarterly 10 - Q, and other reports filed from time - to - time with the Securities and Exchange Commission (SEC). The Company assumes no obligation to provide public updates of forward - looking statements. 2
Today’s Participants Marty Kropelnicki President & CEO Tom Smegal Vice President, CFO & Treasurer Paul Townsley Vice President , Corporate Development and Chief Regulatory Officer Dave Healey Vice President, Controller 3
Presentation Overview • Our Operating Priorities • Recognition of 2018 GRC • Financial Results, Q3 and YTD • Financial Highlights, Q3 and YTD • EPS Bridges • Note on the Company’s E arnings P ower • Continuing COVID - 19 Impacts • California Regulatory Update • Capital Investment Update • Business Development Update • Cap Ex 2008 Recorded to 2021 Projected • Rate Base 2014 Recorded to 2022 P rojected • Wrapping Up and Look Ahead 4
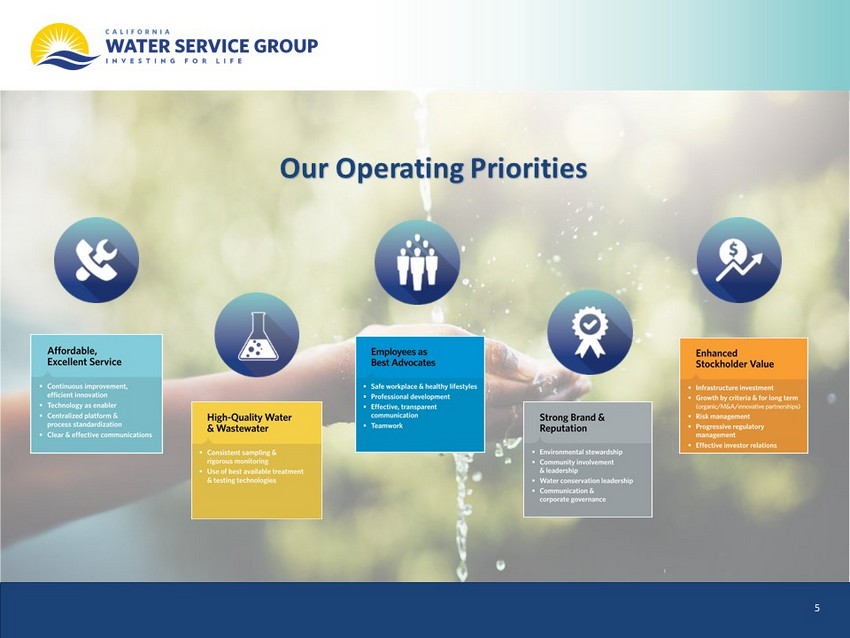
Our Operating Priorities 5
Recognition of the 2018 California GRC • On October 14th, the California Public Utilities Commission (“CPUC”) published a proposed decision in California Water Service Company’s (“Cal Water’s”) delayed 2018 General Rate Case (“GRC”), approving the settlement and proposing to adopt Cal Water’s positions on disputed financial matters in the case. The CPUC can vote on the proposed decision no earlier than November 19th. • B ased on the probable outcome of the GRC decision, the company has recognized three regulatory assets which had not been included in Q1 or Q2 financials: • A net Water Revenue Adjustment Mechanism (WRAM)/Modified Cost Balancing Account (MCBA) regulatory asset of $28.8 million reflecting entries through the third quarter • A net Pension/Medical Cost Balancing A ccount regulatory asset of $8.2 million • An Interim Rate Memorandum Account regulatory asset of $37.6 million • The company also reduced its estimated effective tax rate to account for the refund of $7.1 million of excess deferred income tax embedded in the GRC proposed rates These regulatory assets and liabilities and the effective tax rate are subject to the CPUC’s approval of the 2018 GRC proposed decision and could differ materially if the proposed decision is modified in any significant aspect by the full Commission 6
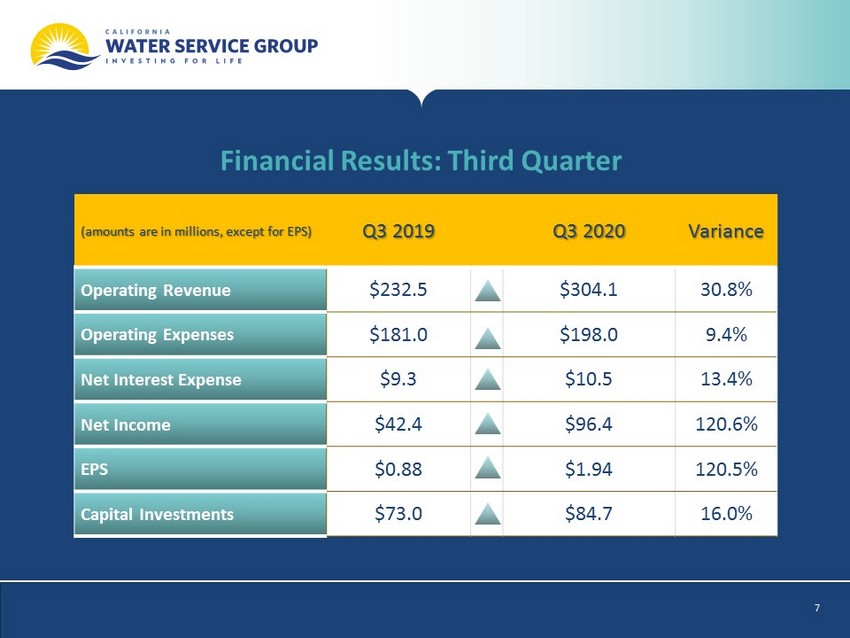
Financial Results: Third Quarter (amounts are in millions, except for EPS) Q3 2019 Q3 2020 Variance Operating Revenue $232.5 $304.1 30.8% Operating Expenses $181.0 $198.0 9.4% Net Interest Expense $9.3 $10.5 13.4% Net In come $42.4 $96.4 120.6% EPS $0.88 $1.94 120.5% Capital Investments $73.0 $84.7 16.0% 7
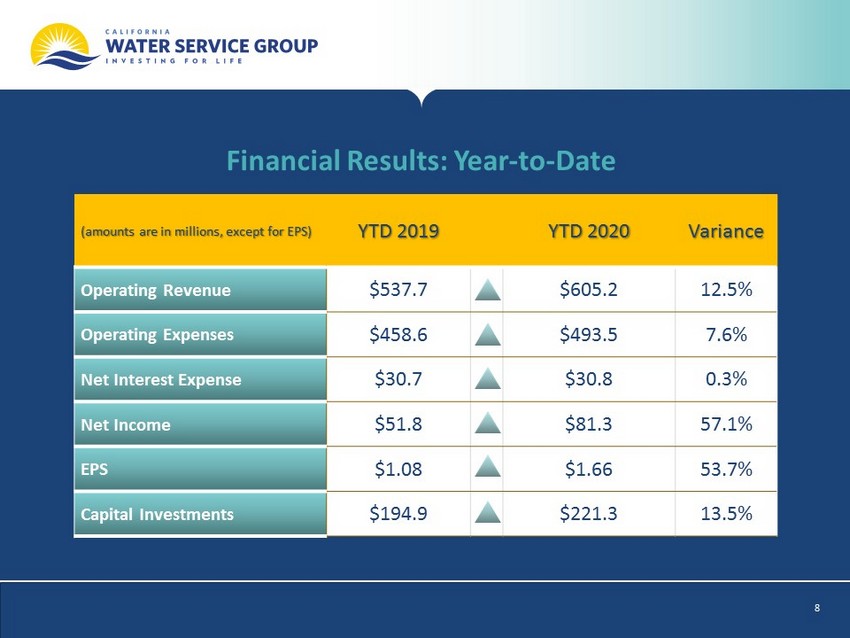
Financial Results: Year - to - Date (amounts are in millions, except for EPS) YTD 2019 YTD 2020 Variance Operating Revenue $537.7 $605.2 12.5% Operating Expenses $458.6 $493.5 7.6% Net Interest Expense $30.7 $30.8 0.3% Net In come $51.8 $81.3 57.1% EPS $1.08 $1.66 53.7% Capital Investments $194.9 $221.3 13.5% 8
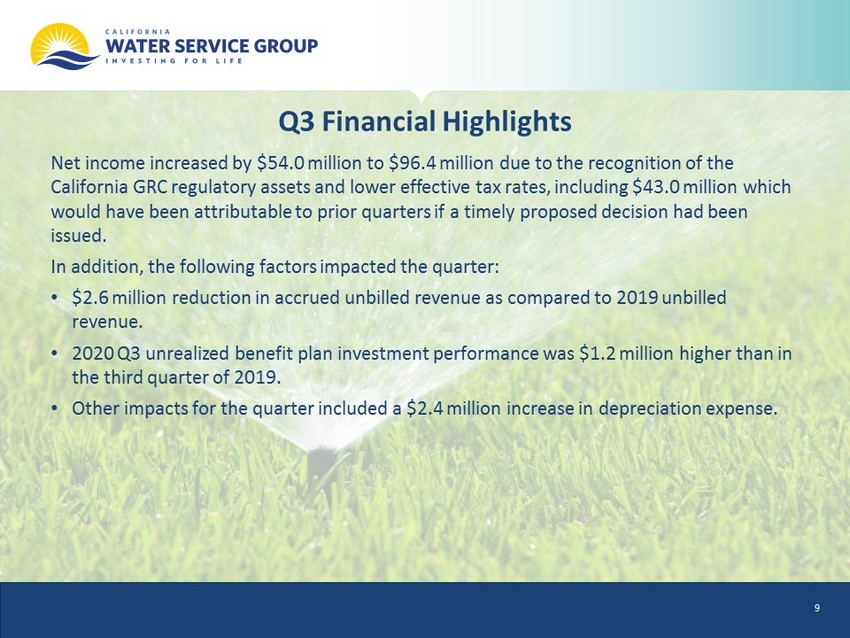
Q3 Financial Highlights Net income increased by $54.0 million to $96.4 million due to the recognition of the California GRC regulatory assets and lower effective tax rates, including $43.0 million which would have been attributable to prior quarters if a timely proposed decision had been issued . In addition, the following factors impacted the quarter: • $2.6 million reduction in accrued unbilled revenue as compared to 2019 unbilled revenue. • 2020 Q3 unrealized benefit plan investment performance was $1.2 million higher than in the third quarter of 2019 . • Other impacts for the quarter included a $2.4 million increase in depreciation expense. 9
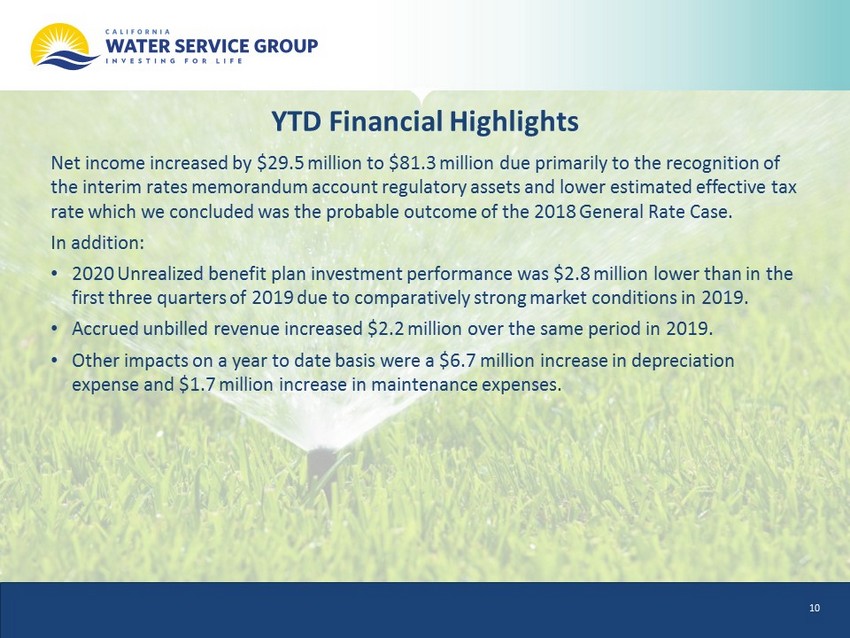
YTD Financial Highlights Net income increased by $29.5 million to $81.3 million due primarily to the recognition of the interim rates memorandum account regulatory assets and lower estimated effective tax rate which we concluded was the probable outcome of the 2018 General Rate Case. In addition: • 2020 Unrealized benefit plan investment performance was $2.8 million lower than in the first three quarters of 2019 due to comparatively strong market conditions in 2019 . • Accrued unbilled revenue increased $2.2 million over the same period in 2019. • Other impacts on a year to date basis were a $6.7 million increase in depreciation expense and $1.7 million increase in maintenance expenses. 10
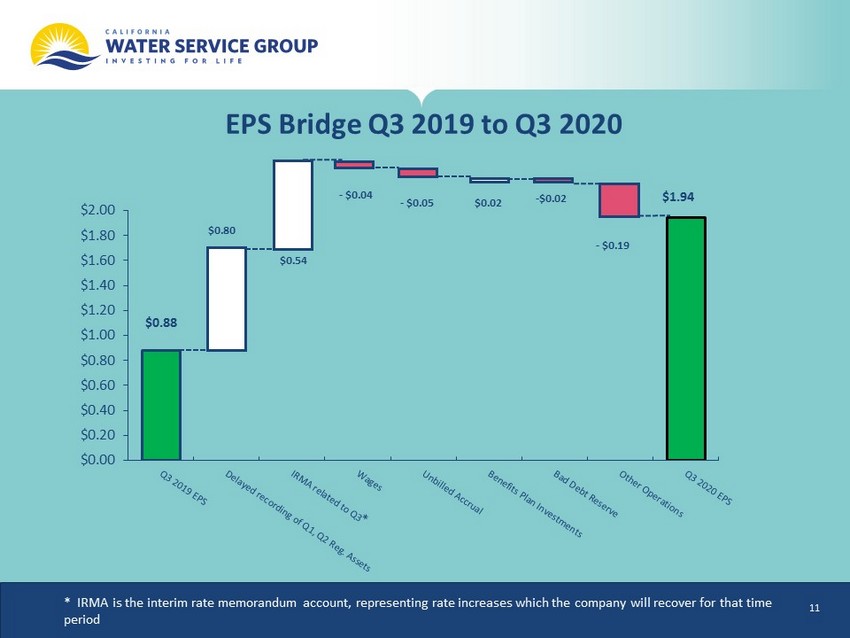
EPS Bridge Q3 2019 to Q3 2020 $0.00 $0.20 $0.40 $0.60 $0.80 $1.00 $1.20 $1.40 $1.60 $1.80 $2.00 - $0.04 $0.02 - $0.02 $ 0.88 $0.54 - $ 0.05 $0.80 $1.94 - $ 0.19 * IRMA is the interim rate memorandum account, representing rate increases which the company will recover for that time period 11
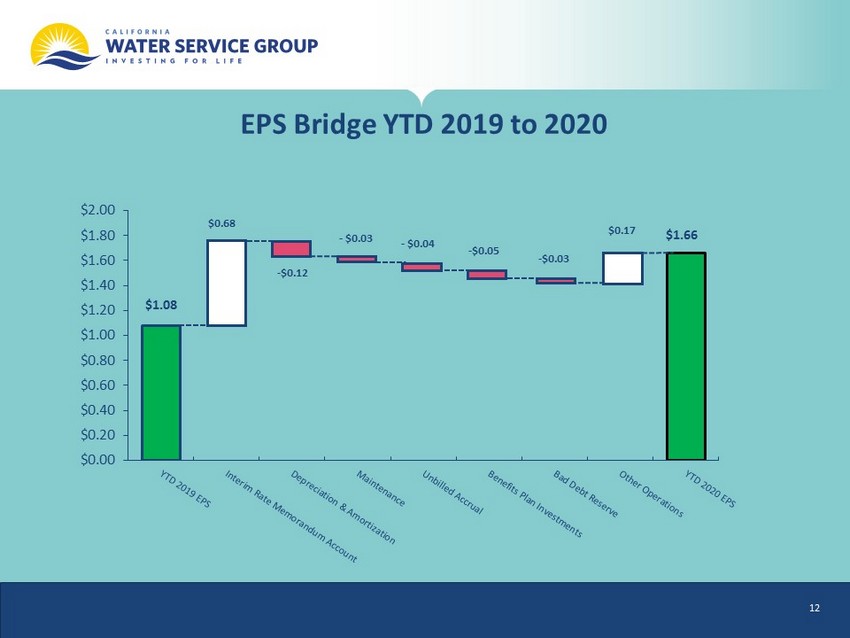
EPS Bridge YTD 2019 to 2020 $0.00 $0.20 $0.40 $0.60 $0.80 $1.00 $1.20 $1.40 $1.60 $1.80 $2.00 - $0.03 - $0.05 - $0.03 $1.08 - $0.12 - $ 0.04 $0.68 $1.66 $0.17 12
Note on the Company’s Earnings Power • California General Rate Case, if the proposed decision is adopted, allows for net income from regulated operations in that state of $76 million in test year 2020, reflecting the authorized equity return on approximately $1.5 billion in rate base. • The company’s other regulated operations represent around $110 million of rate base. • Equity returns on regulated business are dependent on costs being in line with adopted costs. In New Mexico, Washington, and Hawaii returns are also affected by water sales. Beginning in 2023, we expect earnings in California to also be affected by water sales. • On an annual basis, the company does not anticipate net income from changes in unbilled revenue accruals or unrealized changes in the value of certain retirement assets, though these factors are adding $9.6 million to our year - to - date net income. Unbilled revenue accruals decline in the fourth quarter as the weather in most of our service territories cools. • Margins on unregulated activities, recognition of regulatory assets for the equity portion of funds used during construction (“AFUDC”), and state tax timing differences can also have large effects on net income. 13
• We continue to operate with enhanced safety protocols to protect customers and employees from infection. • We have seen increased customer account aging from the suspension of collection activity. o Bills outstanding more than 90 days increased to $5.4 million. Only a portion of such amounts are typically uncollectible. o The company has increased its reserve for doubtful accounts from $1.6 million to $2.7 million in the third quarter. • All four states will continue to suspend water shutoffs through at least the end of 2020. • Incremental COVID - 19 related expenses in the third quarter were less than $0.1 million. Regulatory Commissions in Hawaii and California have allowed accounting to track and potentially recover incremental operating expenses related to the pandemic. • Water sales in aggregate have been close to adopted levels (95% of adopted sales in California), with increases in residential usage being offset by lower business, industrial, and public authority sales. • Liquidity remains strong. As of September 30, we had $113 million of cash and additional current capacity of more than $170 million on lines of credit, subject to meeting borrowing conditions. Continuing Impacts from COVID - 19 Pandemic 14
California Regulatory Update • As discussed above, the CPUC issued a proposed decision in Cal Water’s 2018 GRC adopting the settlement and Cal Water’s positions on monetary disputed items. The Commission cannot vote on the proposed decision until November 19, 2020. • As previously disclosed, the CPUC adopted a policy decision on August 27, 2020 which bars Cal Water from requesting continuation of its WRAM/MCBA decoupling mechanism in the 2021 GRC affecting years 2023 - 2025. o Cal Water has filed an appeal to the Decision, known as a request for rehearing, but the appeal is unlikely to be ruled upon until after the deadline for filing the 2021 GRC. 15
YTD Capital Investment Update • Company and developer - funded capital investments were $221.3 million in the first three quarters of 2020, an increase of 13.5% compared to the same period in 2019. • The Company has previously estimated it would spend $260 - 290 million on capital in 2020. • On October 13, 2020, Cal Water announced it had completed and activated service on the Palos Verdes Peninsula Water Reliability Project, the largest capital project in the company’s history. • On November 5, 2020, the CPUC adopted a decision granting Cal Water’s request for $700 million of additional financing authority which is expected to be used to help finance the company’s approved and projected capital programs through 2025 or later. 16
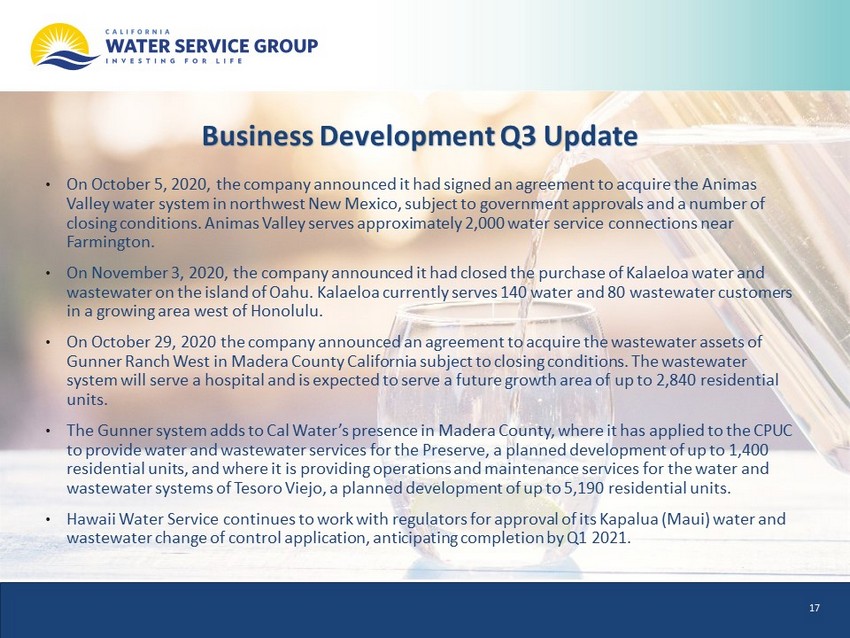
Business Development Q3 Update • On October 5, 2020, the company announced it had signed an agreement to acquire the Animas Valley water system in northwest New Mexico, subject to government approvals and a number of closing conditions. Animas Valley serves approximately 2,000 water service connections near Farmington. • On November 3, 2020, the company announced it had closed the purchase of Kalaeloa water and wastewater on the island of Oahu. Kalaeloa currently serves 140 water and 80 wastewater customers in a growing area west of Honolulu. • On October 29, 2020 the company announced an agreement to acquire the wastewater assets of Gunner Ranch West in Madera County California subject to closing conditions. The wastewater system will serve a hospital and is expected to serve a future growth area of up to 2,840 residential units. • The Gunner system adds to Cal Water’s presence in Madera County, where it has applied to the CPUC to provide water and wastewater services for the Preserve, a planned development of up to 1,400 residential units, and where it is providing operations and maintenance services for the water and wastewater systems of Tesoro Viejo, a planned development of up to 5,190 residential units. • Hawaii Water Service continues to work with regulators for approval of its Kapalua (Maui) water and wastewater change of control application, anticipating completion by Q1 2021. 17
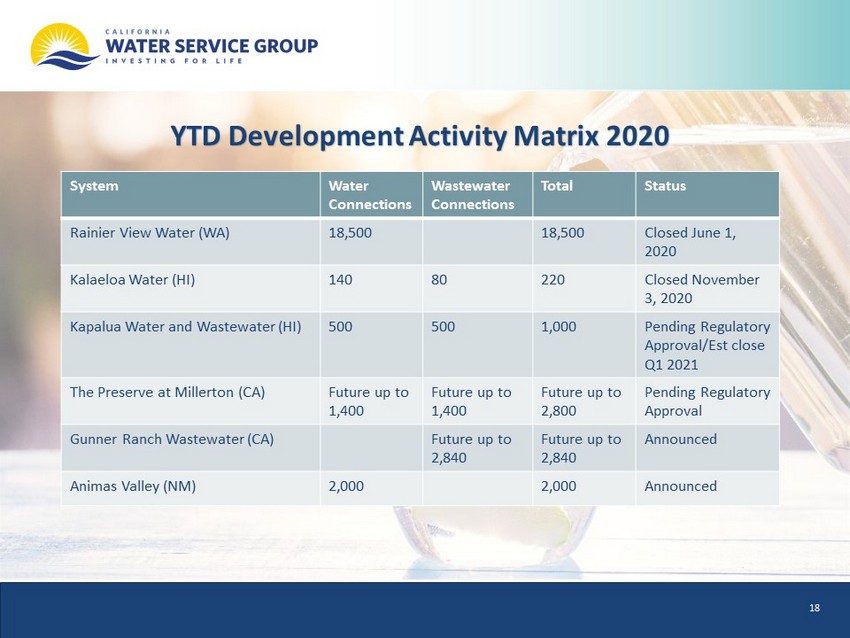
YTD Development Activity Matrix 2020 System Water Connections Wastewater Connections Total Status Rainier View Water (WA) 18,500 18,500 Closed June 1, 2020 Kalaeloa Water (HI) 140 80 220 Closed November 3, 2020 Kapalua Water and Wastewater (HI) 500 500 1,000 Pending Regulatory Approval/Est close Q1 2021 The Preserve at Millerton (CA) Future up to 1,400 Future up to 1,400 Future up to 2,800 Pending Regulatory Approval Gunner Ranch Wastewater (CA) Future up to 2,840 Future up to 2,840 Announced Animas Valley (NM) 2,000 2,000 Announced 18
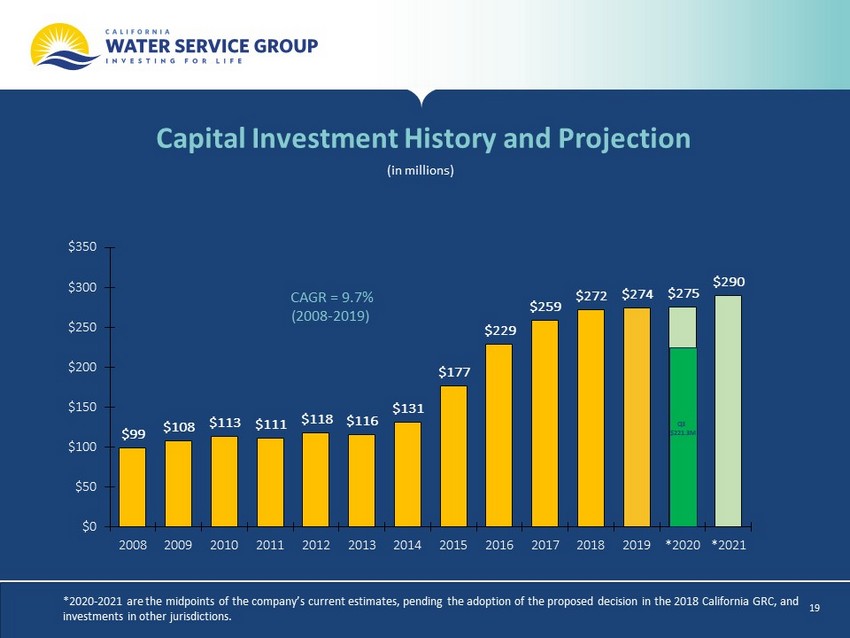
Capital Investment History and Projection (in millions) *2020 - 2021 are the midpoints of the company’s current estimates, pending the adoption of the proposed decision in the 2018 Calif ornia GRC, and investments in other jurisdictions. $99 $108 $113 $111 $118 $116 $131 $177 $229 $259 $272 $274 $275 $290 $0 $50 $100 $150 $200 $250 $300 $350 2008 2009 2010 2011 2012 2013 2014 2015 2016 2017 2018 2019 *2020 *2021 CAGR = 9.7% ( 2008 - 2019) Q3 $221.3M 19
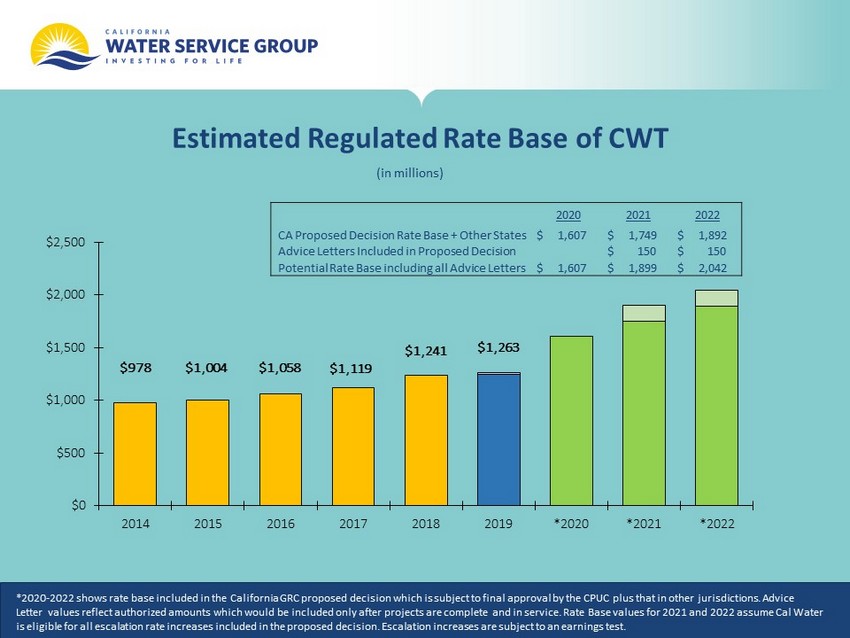
Estimated Regulated Rate Base of CWT (in millions) *2020 - 2022 shows rate base included in the California GRC proposed decision which is subject to final approval by the CPUC plus that in other jurisdicti ons . Advice Letter values reflect authorized amounts which would be included only after projects are complete and in service. Rate Base values for 2021 and 2022 assume Cal Water is eligible for all escalation rate increases included in the proposed decision. Escalation increases are subject to an earni ngs test. $978 $1,004 $1,058 $1,241 $1,119 $ 1,263 $0 $500 $1,000 $1,500 $2,000 $2,500 2014 2015 2016 2017 2018 2019 *2020 *2021 *2022 2020 2021 2022 CA Proposed Decision Rate Base + Other States $ 1,607 $ 1,749 $ 1,892 Advice Letters Included in Proposed Decision $ 150 $ 150 Potential Rate Base including all Advice Letters $ 1,607 $ 1,899 $ 2,042
Wrapping Up and Look Ahead • Finish line is in sight for the 2018 California GRC. We’ll be working to confirm it is completed consistent with the Proposed Decision. • Company operators are providing a high level of service to our customers during COVID - 19 mitigation while keeping our employees safe. • While we concentrate on the current emergency, we have not lost focus on potential future wildfires and ongoing capital improvements. 21
Discussion