EX-99.2
Published on March 1, 2018
Forward-Looking Statements This presentation contains forward-looking statements within the meaning established by the Private Securities Litigation Reform Act of 1995 ("Act"). The forward-looking statements are intended to qualify under provisions of the federal securities laws for "safe harbor" treatment established by the Act. Forward-looking statements are based on currently available information, expectations, estimates, assumptions and projections, and management's judgment. Words such as would, expects, intends, plans, believes, estimates, assumes, anticipates, projects, predicts, forecasts or variations of such words or similar expressions are intended to identify forward-looking statements. The forward-looking statements are not guarantees of future performance. They are subject to uncertainty and changes in circumstances. Actual results may vary materially from what is contained in a forward-looking statement. Factors that may cause a result different than expected or anticipated include, but are not limited to: governmental and regulatory commissions' decisions; changes in regulatory commissions' policies and procedures; the timeliness of regulatory commissions' actions concerning rate relief; changes in tax laws, the interpretation of tax laws, and accounting policies; changes in construction costs and availability of resources; the ability to successfully implement conservation measures; changes in customer water use patterns; the impact of weather and climate on water sales and operating results; and, other risks and unforeseen events. When considering forward-looking statements, you should keep in mind the cautionary statements included in this paragraph, as well as the annual 10-K, Quarterly 10-Q, and other reports filed from time- to-time with the Securities and Exchange Commission (SEC). The Company assumes no obligation to provide public updates of forward-looking statements.
Marty Kropelnicki President & CEO Todays Participants Tom Smegal Vice President, CFO & Treasurer Paul Townsley Vice President, Regulatory Matters & Corporate Development Dave Healey Vice President, Controller

Presentation Overview Our Operating Priorities Financial Results Financial Highlights 2016 - 2017 EPS Bridge Cost of Capital Update Tax Cuts and Jobs Act Outlook for 2018 2018 California GRC California Drought regulatory mechanisms Cap Ex 2007 Recorded to 2018 Projected Rate Base 2014 recorded to 2019 projected Summary
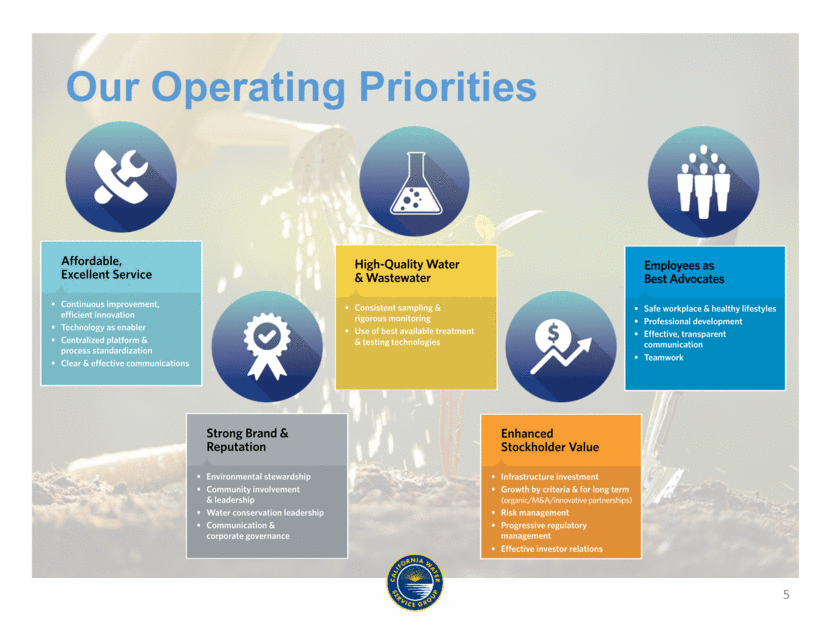
Our Operating Priorities 5
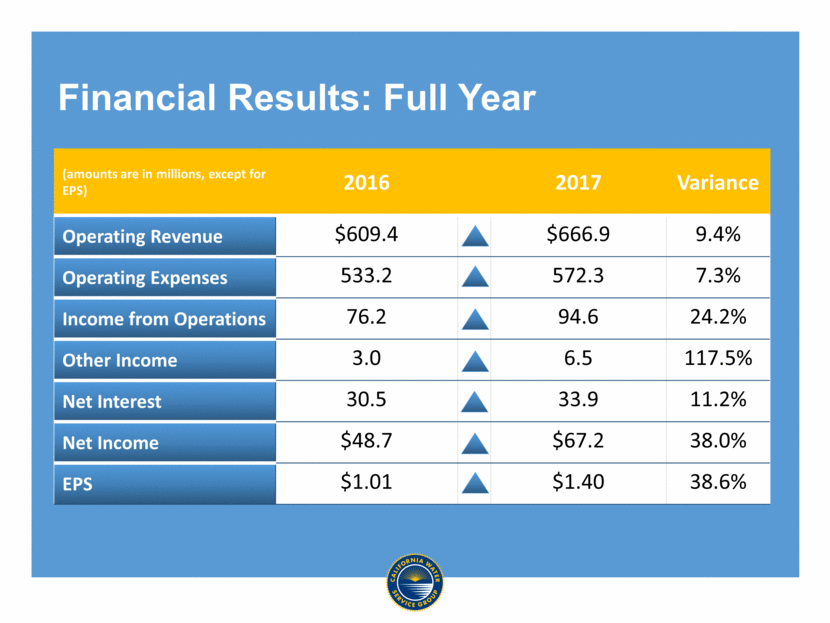
(amounts are in millions, except for EPS) 2016 2017 Variance Operating Revenue $609.4 $666.9 9.4% Operating Expenses 533.2 572.3 7.3% Income from Operations 76.2 94.6 24.2% Other Income 3.0 6.5 117.5% Net Interest 30.5 33.9 11.2% Net Income $48.7 $67.2 38.0% EPS $1.01 $1.40 38.6% Financial Results: Full Year
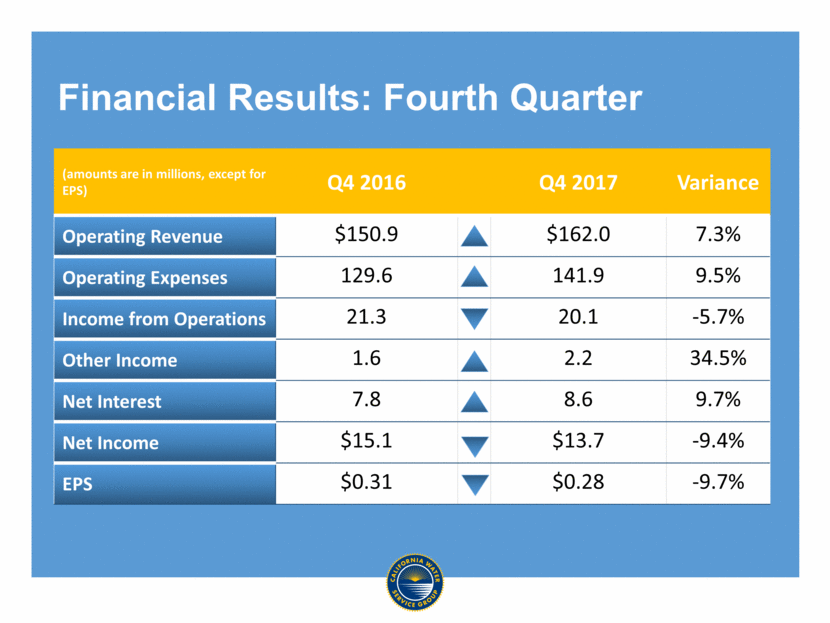
(amounts are in millions, except for EPS) Q4 2016 Q4 2017 Variance Operating Revenue $150.9 $162.0 7.3% Operating Expenses 129.6 141.9 9.5% Income from Operations 21.3 20.1 -5.7% Other Income 1.6 2.2 34.5% Net Interest 7.8 8.6 9.7% Net Income $15.1 $13.7 -9.4% EPS $0.31 $0.28 -9.7% Financial Results: Fourth Quarter
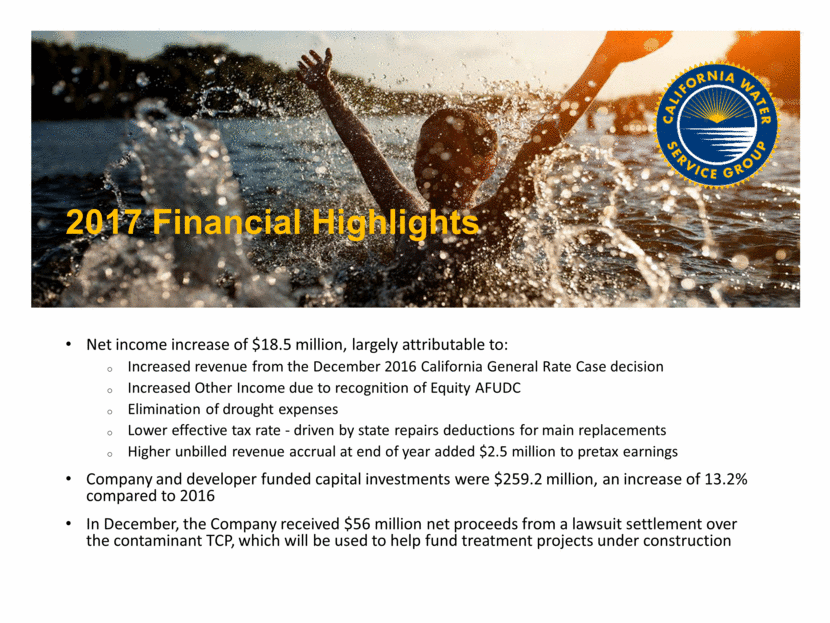
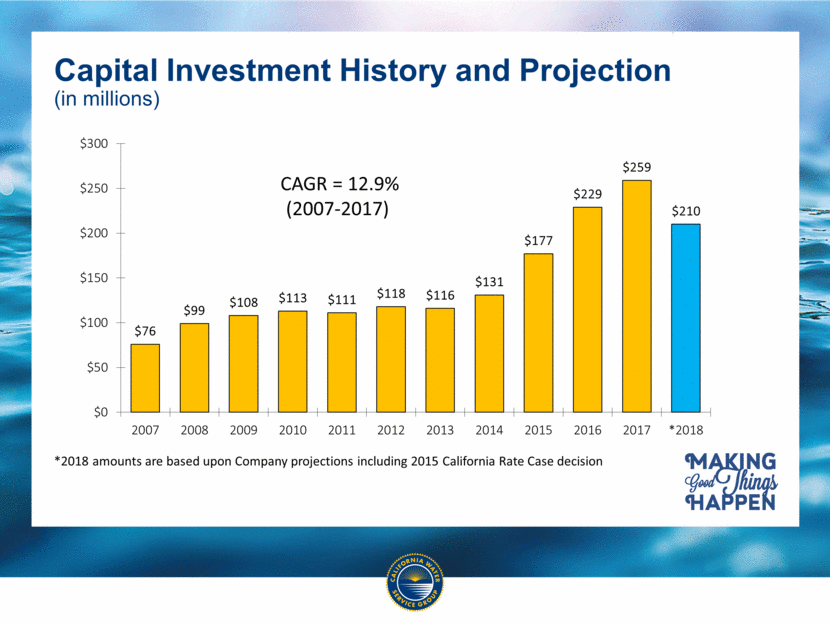
Net income increase of $18.5 million, largely attributable to: Increased revenue from the December 2016 California General Rate Case decision Increased Other Income due to recognition of Equity AFUDC Elimination of drought expenses Lower effective tax rate - driven by state repairs deductions for main replacements Higher unbilled revenue accrual at end of year added $2.5 million to pretax earnings Company and developer funded capital investments were $259.2 million, an increase of 13.2% compared to 2016 In December, the Company received $56 million net proceeds from a lawsuit settlement over the contaminant TCP, which will be used to help fund treatment projects under construction 2017 Financial Highlights
EPS Bridge 2016 to 2017
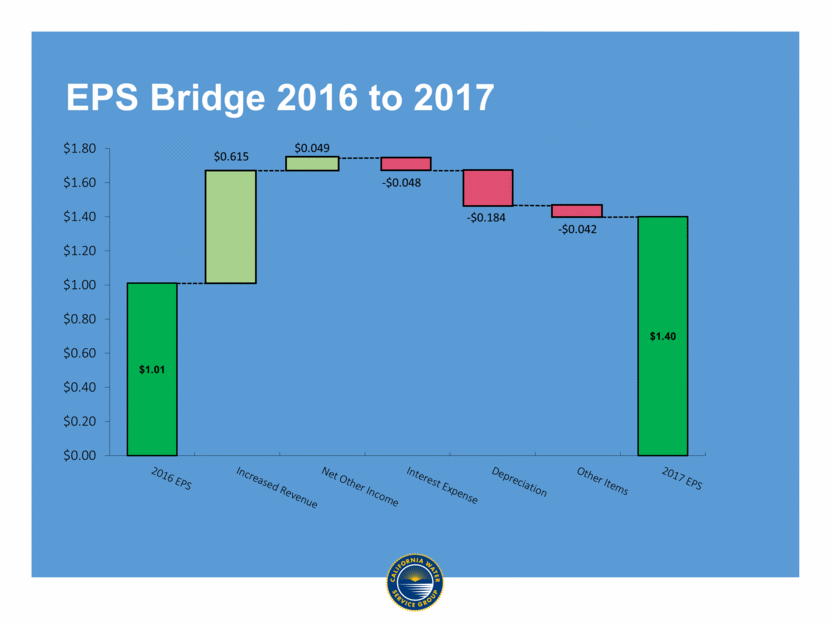
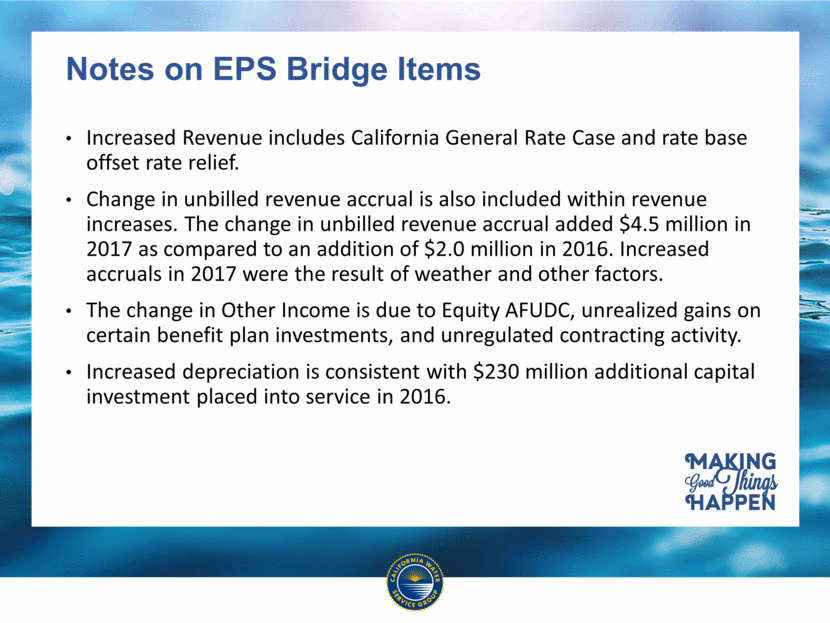
Notes on EPS Bridge Items Increased Revenue includes California General Rate Case and rate base offset rate relief. Change in unbilled revenue accrual is also included within revenue increases. The change in unbilled revenue accrual added $4.5 million in 2017 as compared to an addition of $2.0 million in 2016. Increased accruals in 2017 were the result of weather and other factors. The change in Other Income is due to Equity AFUDC, unrealized gains on certain benefit plan investments, and unregulated contracting activity. Increased depreciation is consistent with $230 million additional capital investment placed into service in 2016.
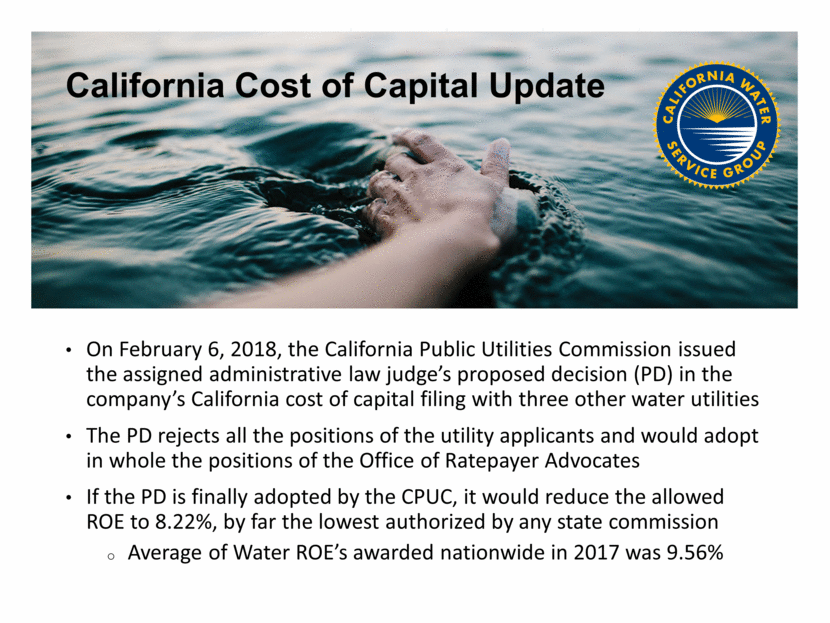
California Cost of Capital Update On February 6, 2018, the California Public Utilities Commission issued the assigned administrative law judges proposed decision (PD) in the companys California cost of capital filing with three other water utilities The PD rejects all the positions of the utility applicants and would adopt in whole the positions of the Office of Ratepayer Advocates If the PD is finally adopted by the CPUC, it would reduce the allowed ROE to 8.22%, by far the lowest authorized by any state commission Average of Water ROEs awarded nationwide in 2017 was 9.56%
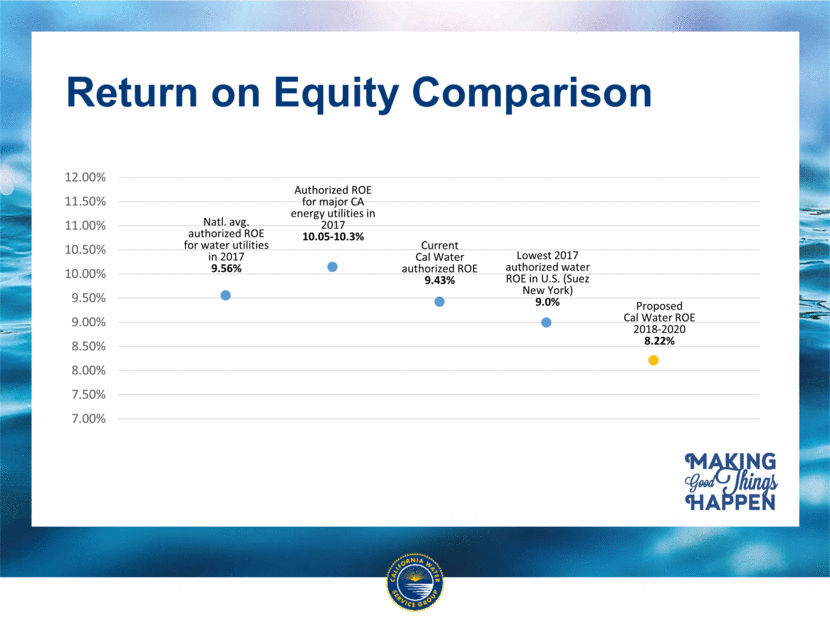
Return on Equity Comparison Natl. avg. authorized ROE for water utilities in 2017 9.56% Authorized ROE for major CA energy utilities in 2017 10.05-10.3% Current Cal Water authorized ROE 9.43% Proposed Cal Water ROE 2018-2020 8.22% Lowest 2017 authorized water ROE in U.S. (Suez New York) 9.0%
Cost of Capital, continued Company management disagrees strongly with the proposed decision Applicant companies have filed comments and met with Commissioner advisors to point out the severe punitive nature of the PD. The PD would cut Cal Waters estimated revenue by around $13 million (range of $0.17-$0.19 on an after-tax EPS basis), and lower customer rates by an average of 2% The PD raises questions about the CPUCs regulatory priorities going forward. The PD claims that Cal Waters WRAM, which was established to align Cal Water with the CPUCs conservation goals and Water Action Plan, and the Commissions escalation and tracker mechanisms, established to correct for the CPUCs lengthy rate case process, render the company nearly risk free. The proposed type of treatment will make it difficult for Cal Water to remain a leader in conservation and other CPUC priorities in future years. CPUC could first consider the PD on March 22nd, when it could approve, reject, or modify it.
Tax Cuts and Jobs Act All four of our regulatory commissions initiated procedures to ensure customers benefit from tax reform Tax expense included in rates will decline Customers will likely see a 1-2% rate reduction on average monthly bills Utilities lose several important tax deductions including bonus depreciation and Section 199, leading to higher current year tax obligations and lower free cash flow Company expects to pay cash taxes in 2020 once its prior year NOL is exhausted Re-measurement of deferred income taxes at 12/31/17 resulted in an excess deferred income tax liability of $108 million The amount varies by state and has been recorded as a regulatory liability or asset The timing and mechanism of customer refund will be determined through the regulatory process in each state
Outlook for 2018 2018 capital investment range of $200-220 million, due to front-loading in 2016-2017 of California 3-year approved budget Cal Water received approval for $15.9 million escalation increase in California effective January 1, 2018 Depreciation expense anticipated to be $6-7 million higher and interest cost expected to be around $2 million higher in 2018 due to 2017 plant investments Through January 1, 2018, the CPUC has approved advice letter projects totaling an additional $2.8 million annual revenue out of an authorization of up to $30 million through 2019 At this time, we estimate a 2018 effective tax rate of 24%, close to the statutory rate of 28% due to reduced budget for repairs-eligible projects, though this could change as the law gets interpreted Unbilled revenue accrual was high at year-end due to dry weather in California and the company does not anticipate a recurrence of the $2.5 million increase in 2018. Beginning with the first quarter of 2018, the non-service components of pension expense will be included with other income and expense due to the implementation of FASB ASU 2017-07
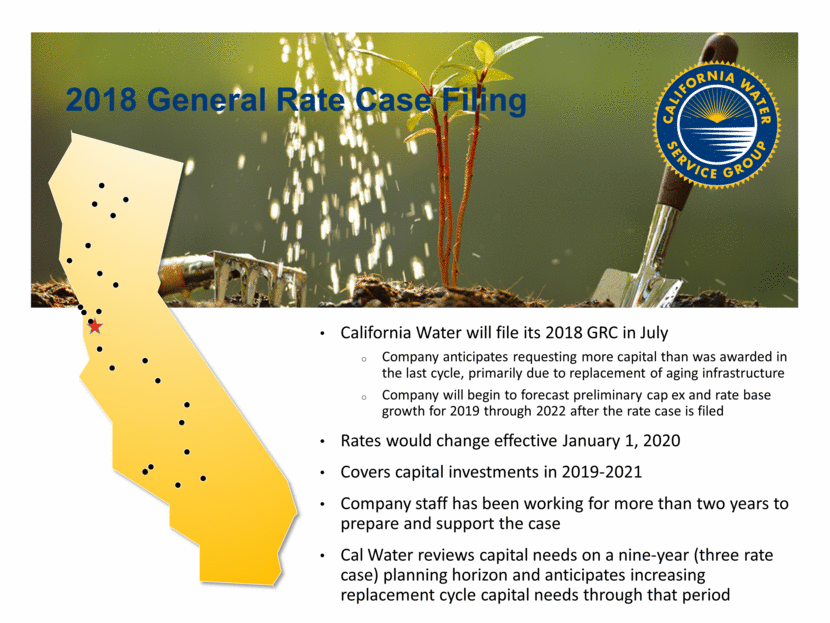
California Water will file its 2018 GRC in July Company anticipates requesting more capital than was awarded in the last cycle, primarily due to replacement of aging infrastructure Company will begin to forecast preliminary cap ex and rate base growth for 2019 through 2022 after the rate case is filed Rates would change effective January 1, 2020 Covers capital investments in 2019-2021 Company staff has been working for more than two years to prepare and support the case Cal Water reviews capital needs on a nine-year (three rate case) planning horizon and anticipates increasing replacement cycle capital needs through that period 2018 General Rate Case Filing
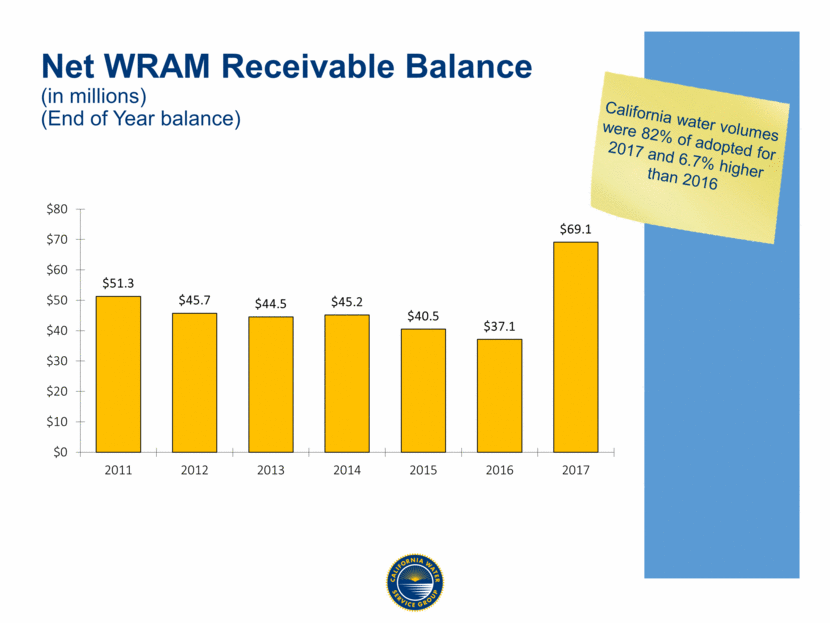
California Drought Recovery and Regulatory Mechanisms California continues to be decoupled, but the net receivable balance in the Water Revenue Adjustment Mechanism (WRAM) grew to $69.1 million in 2017 California sales increased 6.7% but were only 82% of adopted volumes Along with escalation filing, Cal Water received an adjustment in adopted sales volumes through the Sales Reconciliation Mechanism (SRM) of 9% Cash collection should improve, reducing upward pressure on the WRAM Annual amortization of prior year WRAM balances begins in the second quarter California is experiencing a drier-than-normal winter in 2017-2018 Snowpack is 20% of average and precipitation is 57% of average as of February 28 However, reservoir storage is above normal for the date
Net WRAM Receivable Balance (in millions) (End of Year balance) California water volumes were 82% of adopted for 2017 and 6.7% higher than 2016
Capital Investment History and Projection (in millions) *2018 amounts are based upon Company projections including 2015 California Rate Case decision CAGR = 12.9% (2007-2017)
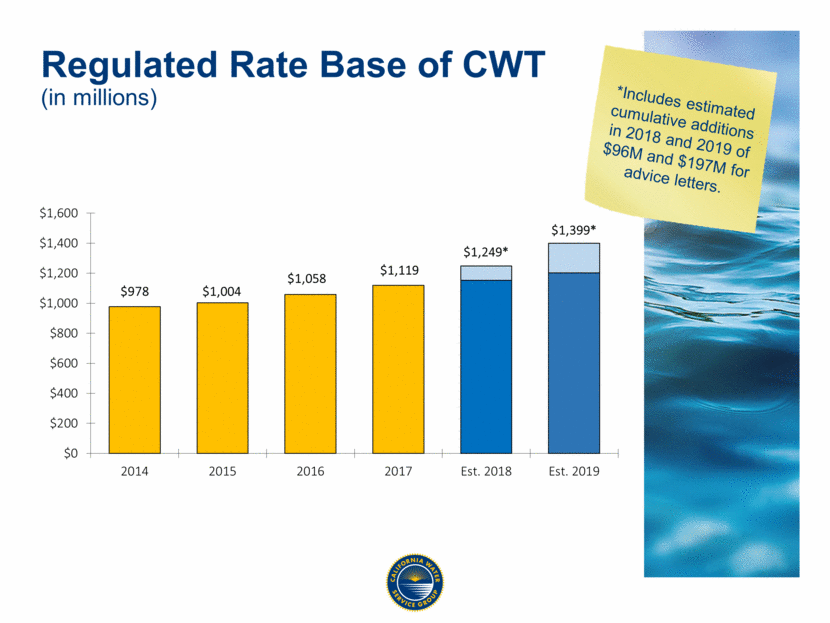
Regulated Rate Base of CWT Regulated Rate Base of CWT (in millions) *Includes estimated cumulative additions in 2018 and 2019 of $96M and $197M for advice letters.
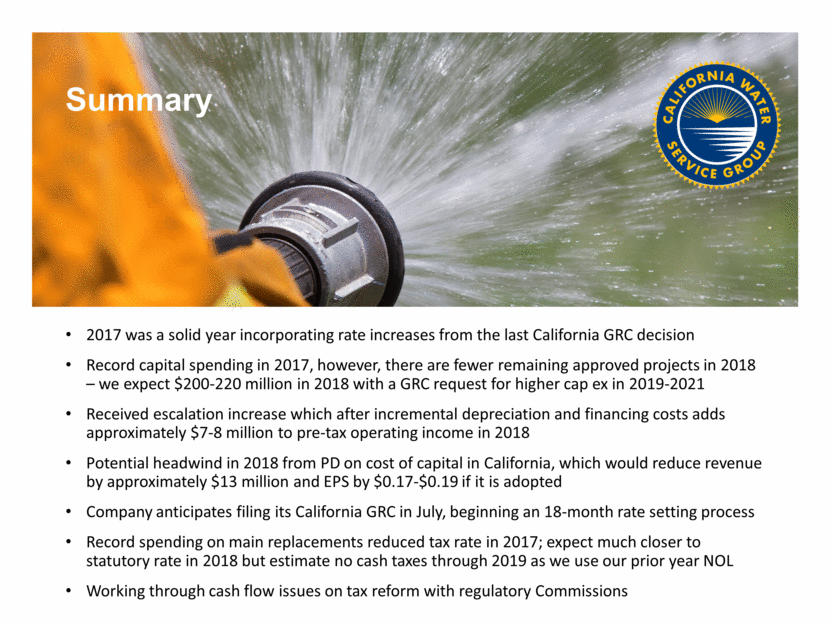
Summary 2017 was a solid year incorporating rate increases from the last California GRC decision Record capital spending in 2017, however, there are fewer remaining approved projects in 2018 we expect $200-220 million in 2018 with a GRC request for higher cap ex in 2019-2021 Received escalation increase which after incremental depreciation and financing costs adds approximately $7-8 million to pre-tax operating income in 2018 Potential headwind in 2018 from PD on cost of capital in California, which would reduce revenue by approximately $13 million and EPS by $0.17-$0.19 if it is adopted Company anticipates filing its California GRC in July, beginning an 18-month rate setting process Record spending on main replacements reduced tax rate in 2017; expect much closer to statutory rate in 2018 but estimate no cash taxes through 2019 as we use our prior year NOL Working through cash flow issues on tax reform with regulatory Commissions
Discussion

